Set Up Production Monitoring
How to start monitoring your LLM application in production - configure sampling, connect external tools, start logging, and know what to watch for.
Once you've deployed a version, Deepchecks can monitor its quality in production over time - tracking annotation trends, property scores, and detecting degradation automatically. This guide covers the setup steps.
→ For an overview of what production monitoring looks like once it's running, see Production Monitoring.
Step 1: Configure sampling
In production, you typically don't need to evaluate every interaction - only a representative sample. Sampling keeps costs in check while preserving statistical validity.
To configure sampling:
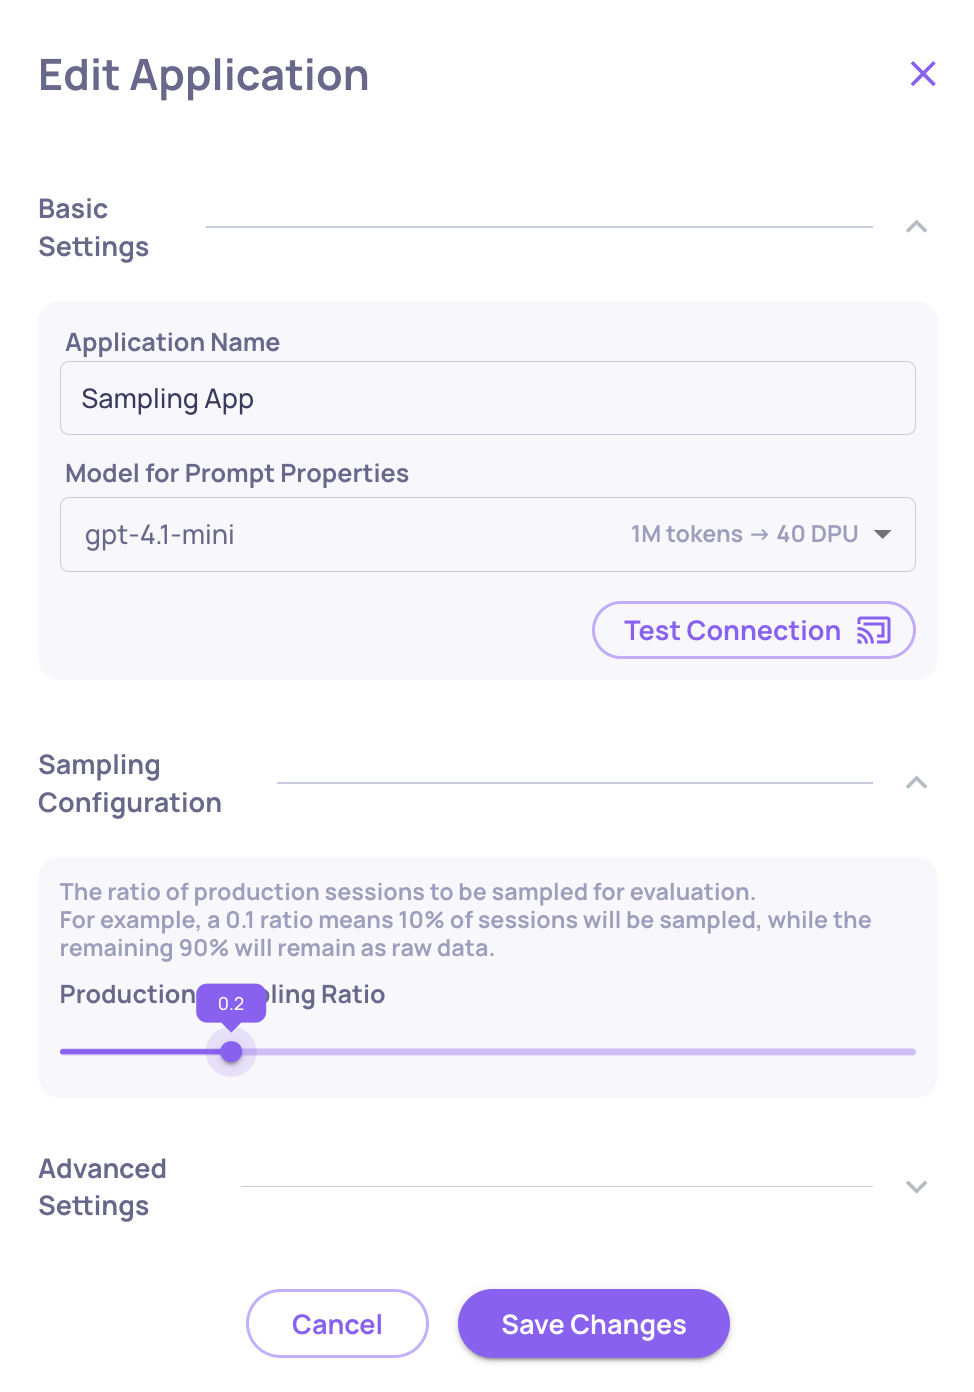
- Go to Manage Applications and click Edit Application
- Set the Sampling Ratio - for high-volume applications,
0.2(20%) is a good starting point. Deepchecks uses random selection, so the evaluated sample is statistically representative.
At 20% sampling, you're spending roughly 35% of what full evaluation would cost while still getting reliable quality signals.
What happens to the rest? Interactions that aren't sampled for evaluation are stored in the Storage screen - visible as raw data, filterable by date and version. You can selectively send individual stored sessions for full evaluation if something looks interesting.
→ See Optimize Costs & Usage for more on controlling evaluation spend.
Step 2: Connect external monitoring (optional)
If your team uses Datadog or New Relic for observability, you can forward Deepchecks quality metrics there - so LLM quality sits alongside your infrastructure metrics and alerting.
Configure these integrations from Settings → Integrations:
- Datadog - send annotation scores and property averages as custom metrics
- New Relic - forward metrics for unified dashboarding and alerting
Once connected, you can set alerts in your existing tools when annotation scores drop below a threshold.
Step 3: Log to the production environment
The only change needed in your integration code is env_type=EnvType.PROD. Everything else - the SDK calls, the data fields - stays the same:
from deepchecks_llm_client.client import DeepchecksLLMClient
from deepchecks_llm_client.data_types import EnvType, LogInteraction

dc_client = DeepchecksLLMClient(api_token="YOUR_API_KEY")

# In your production request handler:
dc_client.log_interaction(
    app_name="my-app",
    version_name="v1",
    env_type=EnvType.PROD,   # <-- production
    interaction=LogInteraction(
        input=user_input,
        output=model_output,
        full_prompt=full_prompt,
        # ... other fields
    )
)
If you're using auto-instrumentation (CrewAI, LangGraph, LangChain), set the environment tag to PROD in your instrumentation configuration.
Step 4: Know what to watch for
Once production data is flowing, check the production Overview screen regularly:
Annotation trends - Is the share of Bad interactions stable, rising, or falling? A rising trend means quality is degrading.
Property score trends - Which specific properties are drifting? A drop in Grounded in Context suggests a retrieval or prompt change had unintended side effects.
Score breakdown comparison - Compare two time ranges side by side to identify exactly when a shift happened and which properties changed. Useful after deployments or data drift.
Insights - Run automated insights on a production time window to surface failure clusters and weak segments you might not catch by looking at trends alone.
Updated 3 months ago