Root Cause Analysis
Investigate why your LLM application fails - property explainability, annotation breakdowns, automated insights, and failure mode analysis.
Once properties and annotations have been calculated, you have a quality signal for every interaction. The next question is: when something goes wrong, why? Deepchecks provides a layered set of tools to trace problems from the high-level - which properties are failing and how often - all the way down to specific interactions and root causes.
At a glance
| Tool | What it answers | Where to find it |
|---|---|---|
| Property explainability | Why did this specific interaction score the way it did? | Interaction detail view |
| Annotation breakdown | Which properties are driving failures, and how often? | Overview screen → Summary section |
| Insights | What failure patterns and weak segments does my data show? | Overview screen → Insights panel |
| Failure mode analysis | What are the main failure categories in my failing interactions? | The analyze-failures icon - available at the property, interaction type, agent, and version level |
Property explainability
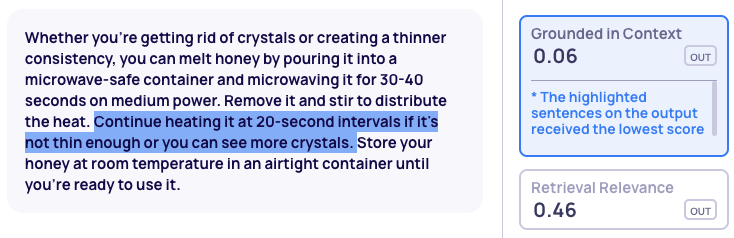
Start at the individual interaction level. In the interaction detail view (click any row in the Interactions screen), property explainability gives you a granular understanding of each score. Depending on the property type, you get either a detailed explanation of the scoring reasoning or a highlighted chunk of the output showing where the score is lowest or highest.
This is the most direct way to understand why a specific interaction was flagged.
Annotation breakdown
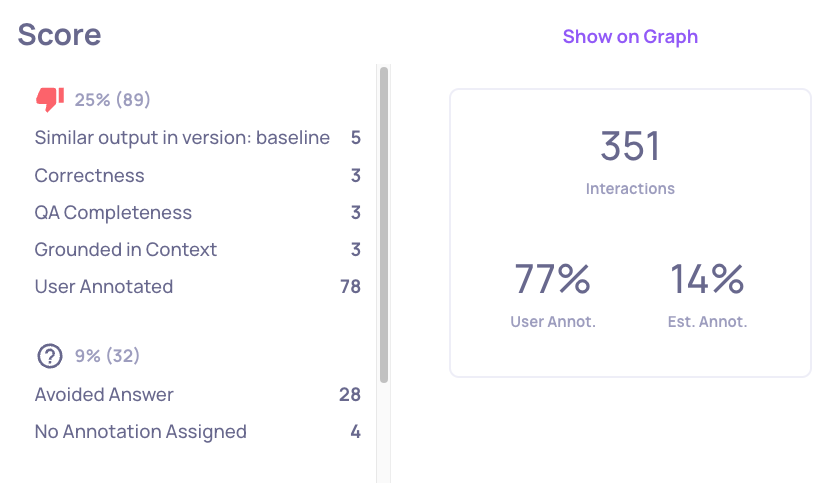
Zoom out to the version or interaction type level. On the Overview screen, the annotation breakdown shows the distribution of Bad annotations - which properties are driving failures and how often.
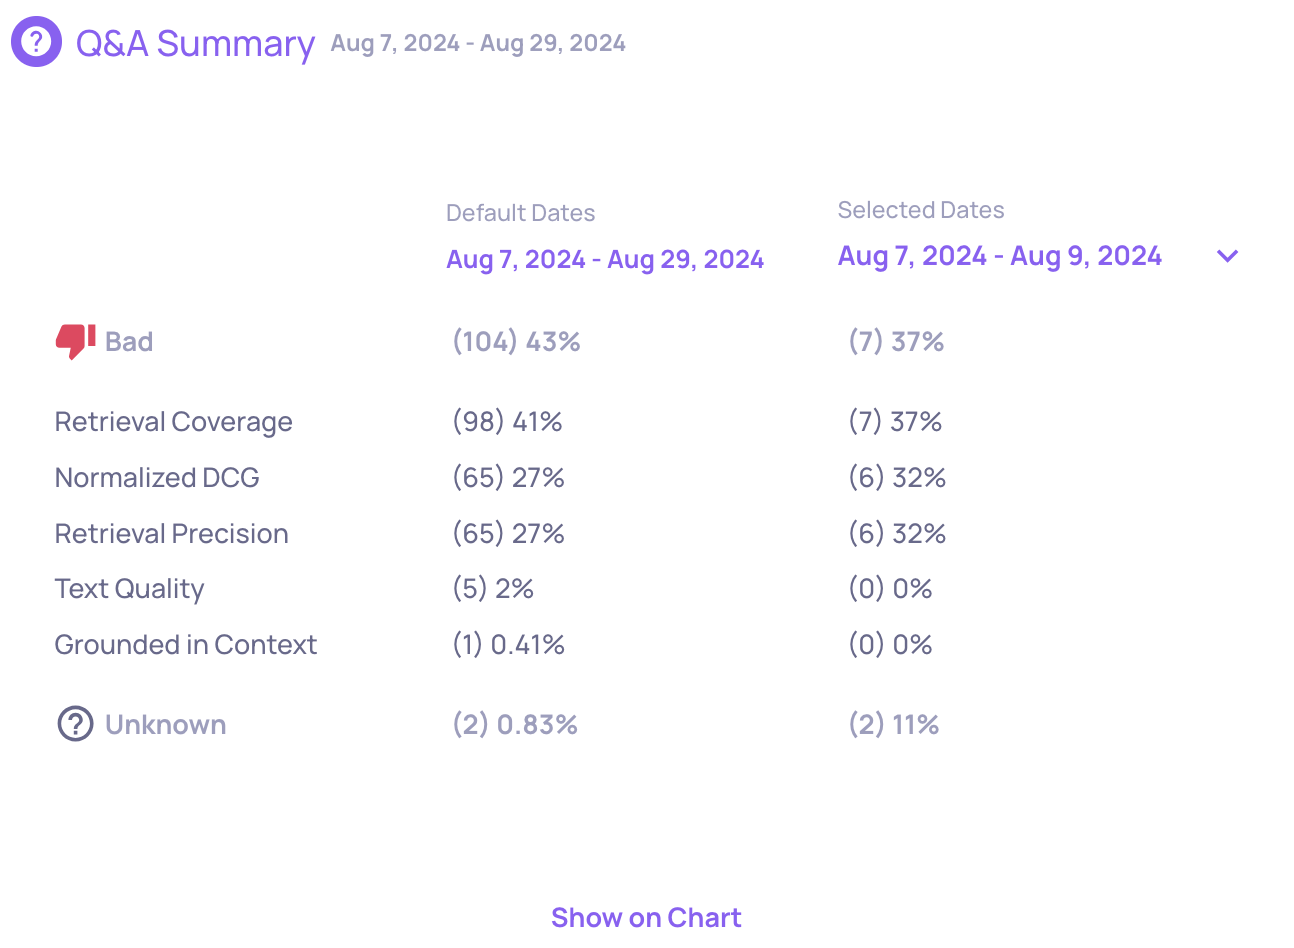
In the production environment, you can compare the breakdown across two different time ranges to identify trends and detect drift.
Clicking a property or annotation reason navigates to the Interactions screen with the relevant filters applied, showing only the affected interactions.
Insights
The Insights panel on the Overview screen provides automated, AI-generated analysis of your application's performance. Insights are scoped to the filters currently applied - Interaction Type, Session filters, specific agent steps - so the analysis reflects exactly the data you are looking at.
Click Generate Insights to run the analysis (available once enough data has been logged). After additional data comes in, click Recalculate to refresh.
Insights has three components, all calculated together:
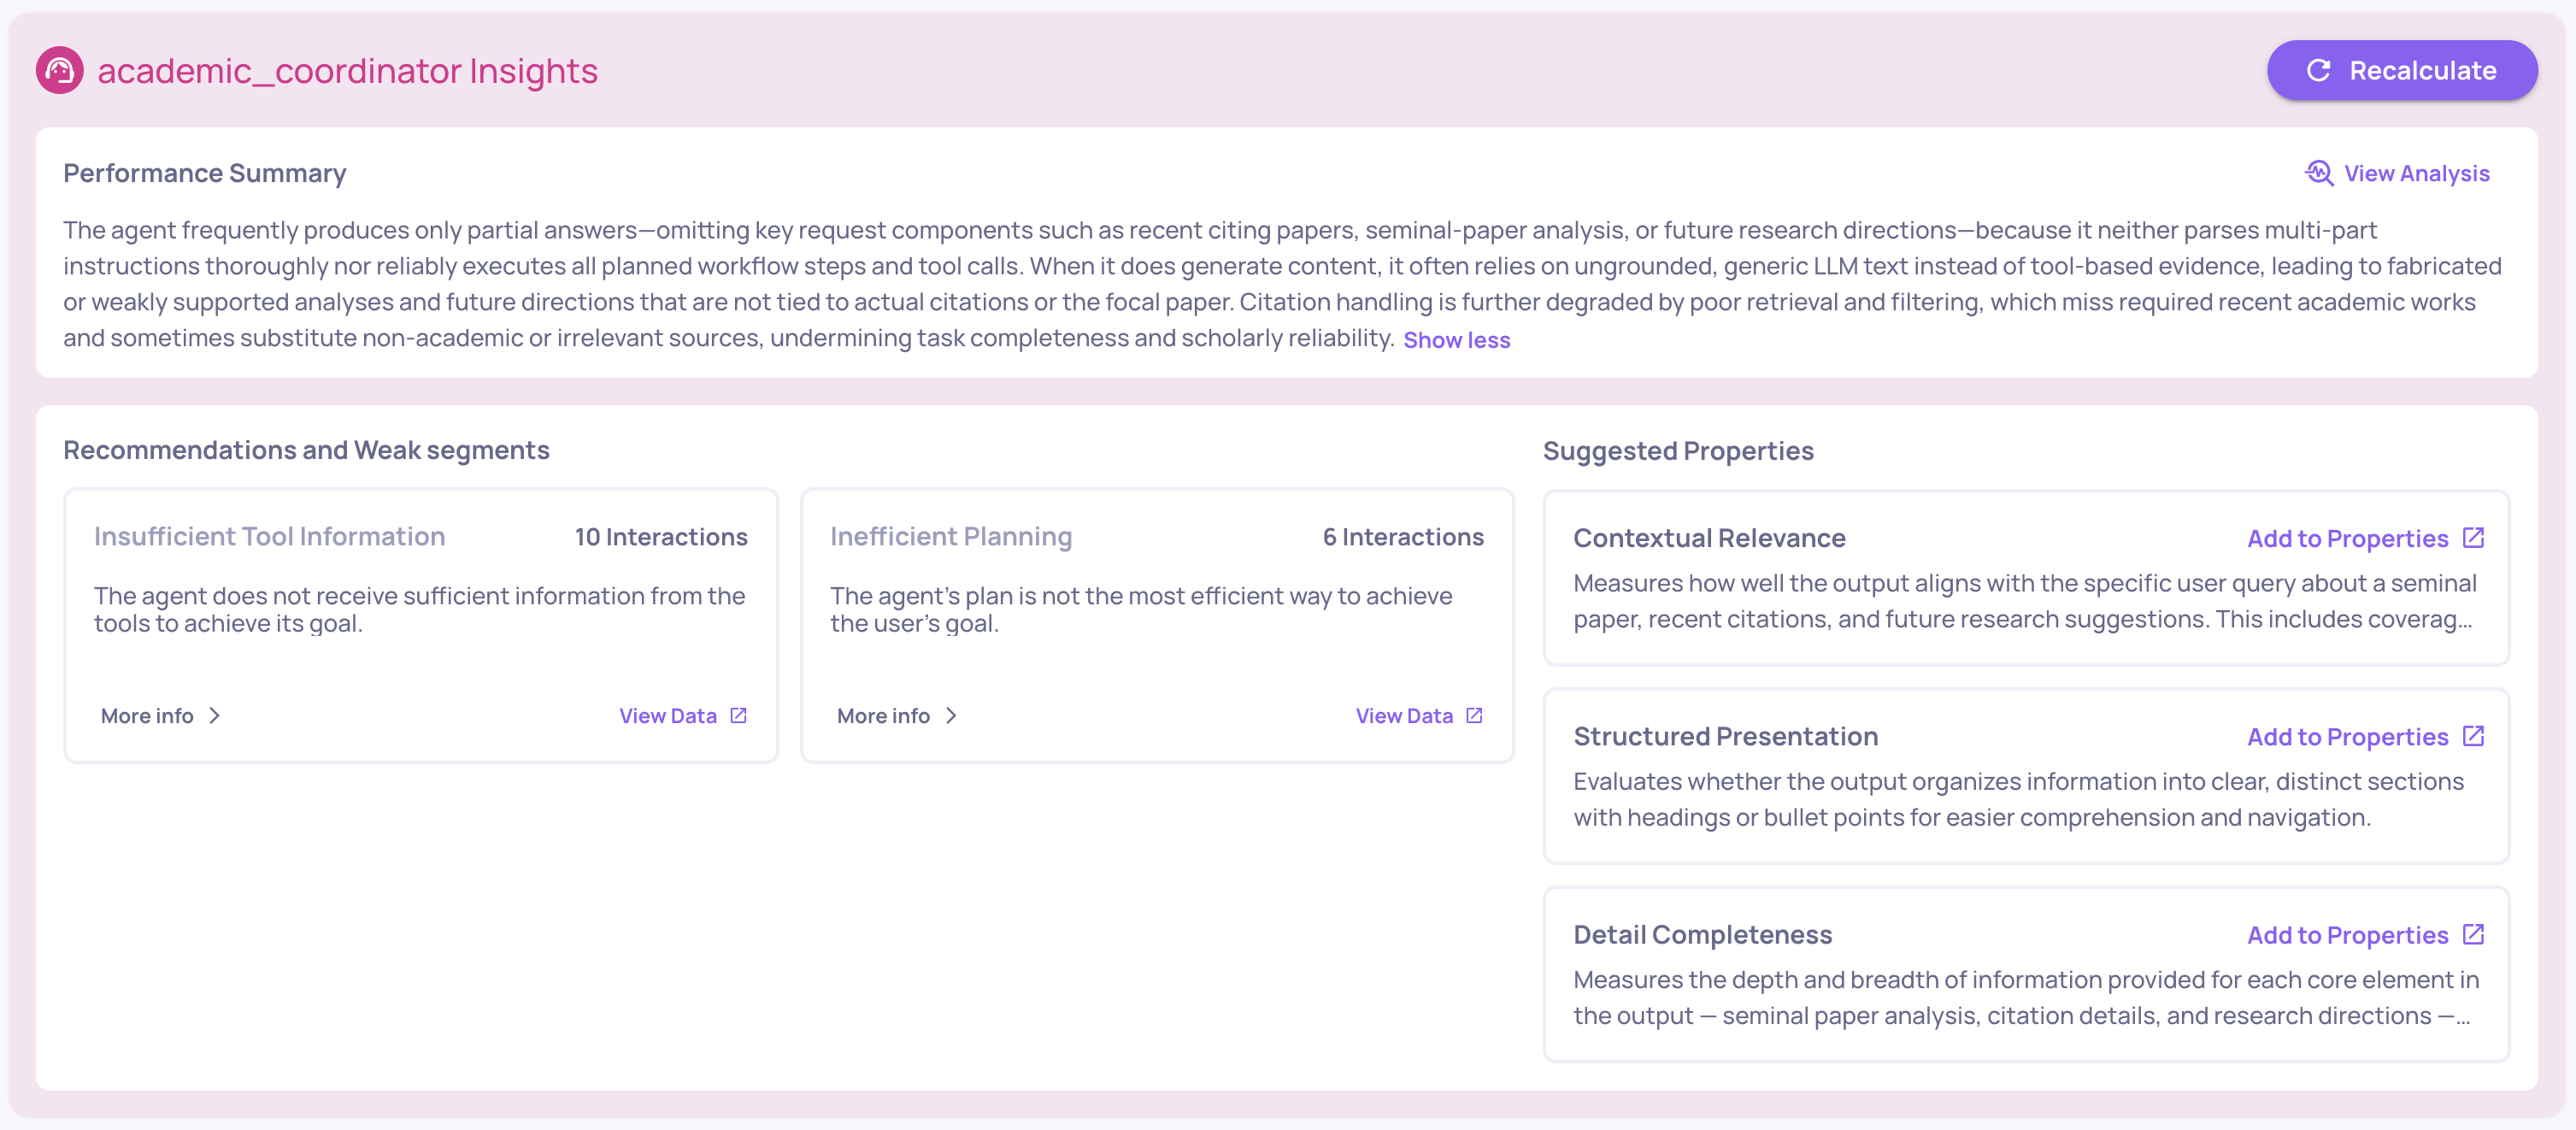
Performance summary - A concise AI-generated overview of key performance trends and patterns. Highlights what is working well and where quality issues are concentrated. Click View Analysis for a detailed breakdown.
Recommendations and weak segments - Deepchecks identifies two types of findings:
- Recommendations - Common failure patterns detected across properties. For example, if PII Risk and Grounded in Context both score high, it may indicate retrieved data contains personal information that isn't being filtered. Each recommendation includes an analysis and actionable suggestions.
- Weak segments - Specific data segments where your application underperforms relative to the overall average.
Each finding links directly to the relevant interactions for drill-down.
Suggested prompt properties - Based on a sample of interactions, Deepchecks suggests custom prompt properties that could be valuable for your specific use case. Each suggestion includes a name, definition, and rationale. You can add any suggestion directly to your properties with one click.
Failure mode analysis
Failure mode analysis is an LLM-powered tool that reads through your failing interactions, identifies patterns, and groups them into high-level failure categories - each with concrete examples and, where possible, an estimated root cause.
It's available at multiple levels. Look for the analyze-failures icon anywhere in the UI and click it to generate analysis at that level:
- Single property - Analyzes failures for one specific property within the current view. Surfaces patterns like recurring phrasing issues, incorrect reasoning steps, or systematic violations of the property's rules. Available from the property card menu or the property drill-down view. Requires at least 5 low-scoring interactions.
- Agent - Analyzes failures across all interaction types within an agent, giving a unified picture of how the agent is failing end-to-end.
- Interaction type - Aggregates failures across all properties within a single interaction type (e.g., only your Q&A interactions or only your tool calls). Useful when you want to focus on one step in your pipeline.
- Full version - Aggregates failures across all interaction types and all evaluation properties in the version. Useful before deploying - run it on your evaluation set to understand failure modes before going to production.
You can also provide custom guidelines to the analysis - assumptions, suspected failure modes, or areas of concern - to focus the output on what matters to you.
For LLM-based properties (with full reasoning), the analysis includes estimated root causes per category. For built-in GPU properties (where only highlighted text is available), it clusters content patterns and presents representative examples.
Filtering the Overview screen
All the analysis tools above are scoped to the filters on the Overview screen:
-
Global filters (top of page) - Application, Version, and Time Range

-
Local filters (within the page) - Interaction Type, agent step filters (e.g., filter by specific span name or run status)
Narrowing the filters before generating insights or failure mode analysis focuses the output on the specific area you're investigating.
Updated 3 months ago