
Compare Between Versions
With proper evaluation criteria established through Root Cause Analysis, let's analyze performance differences across agent configurations to identify optimal setups.
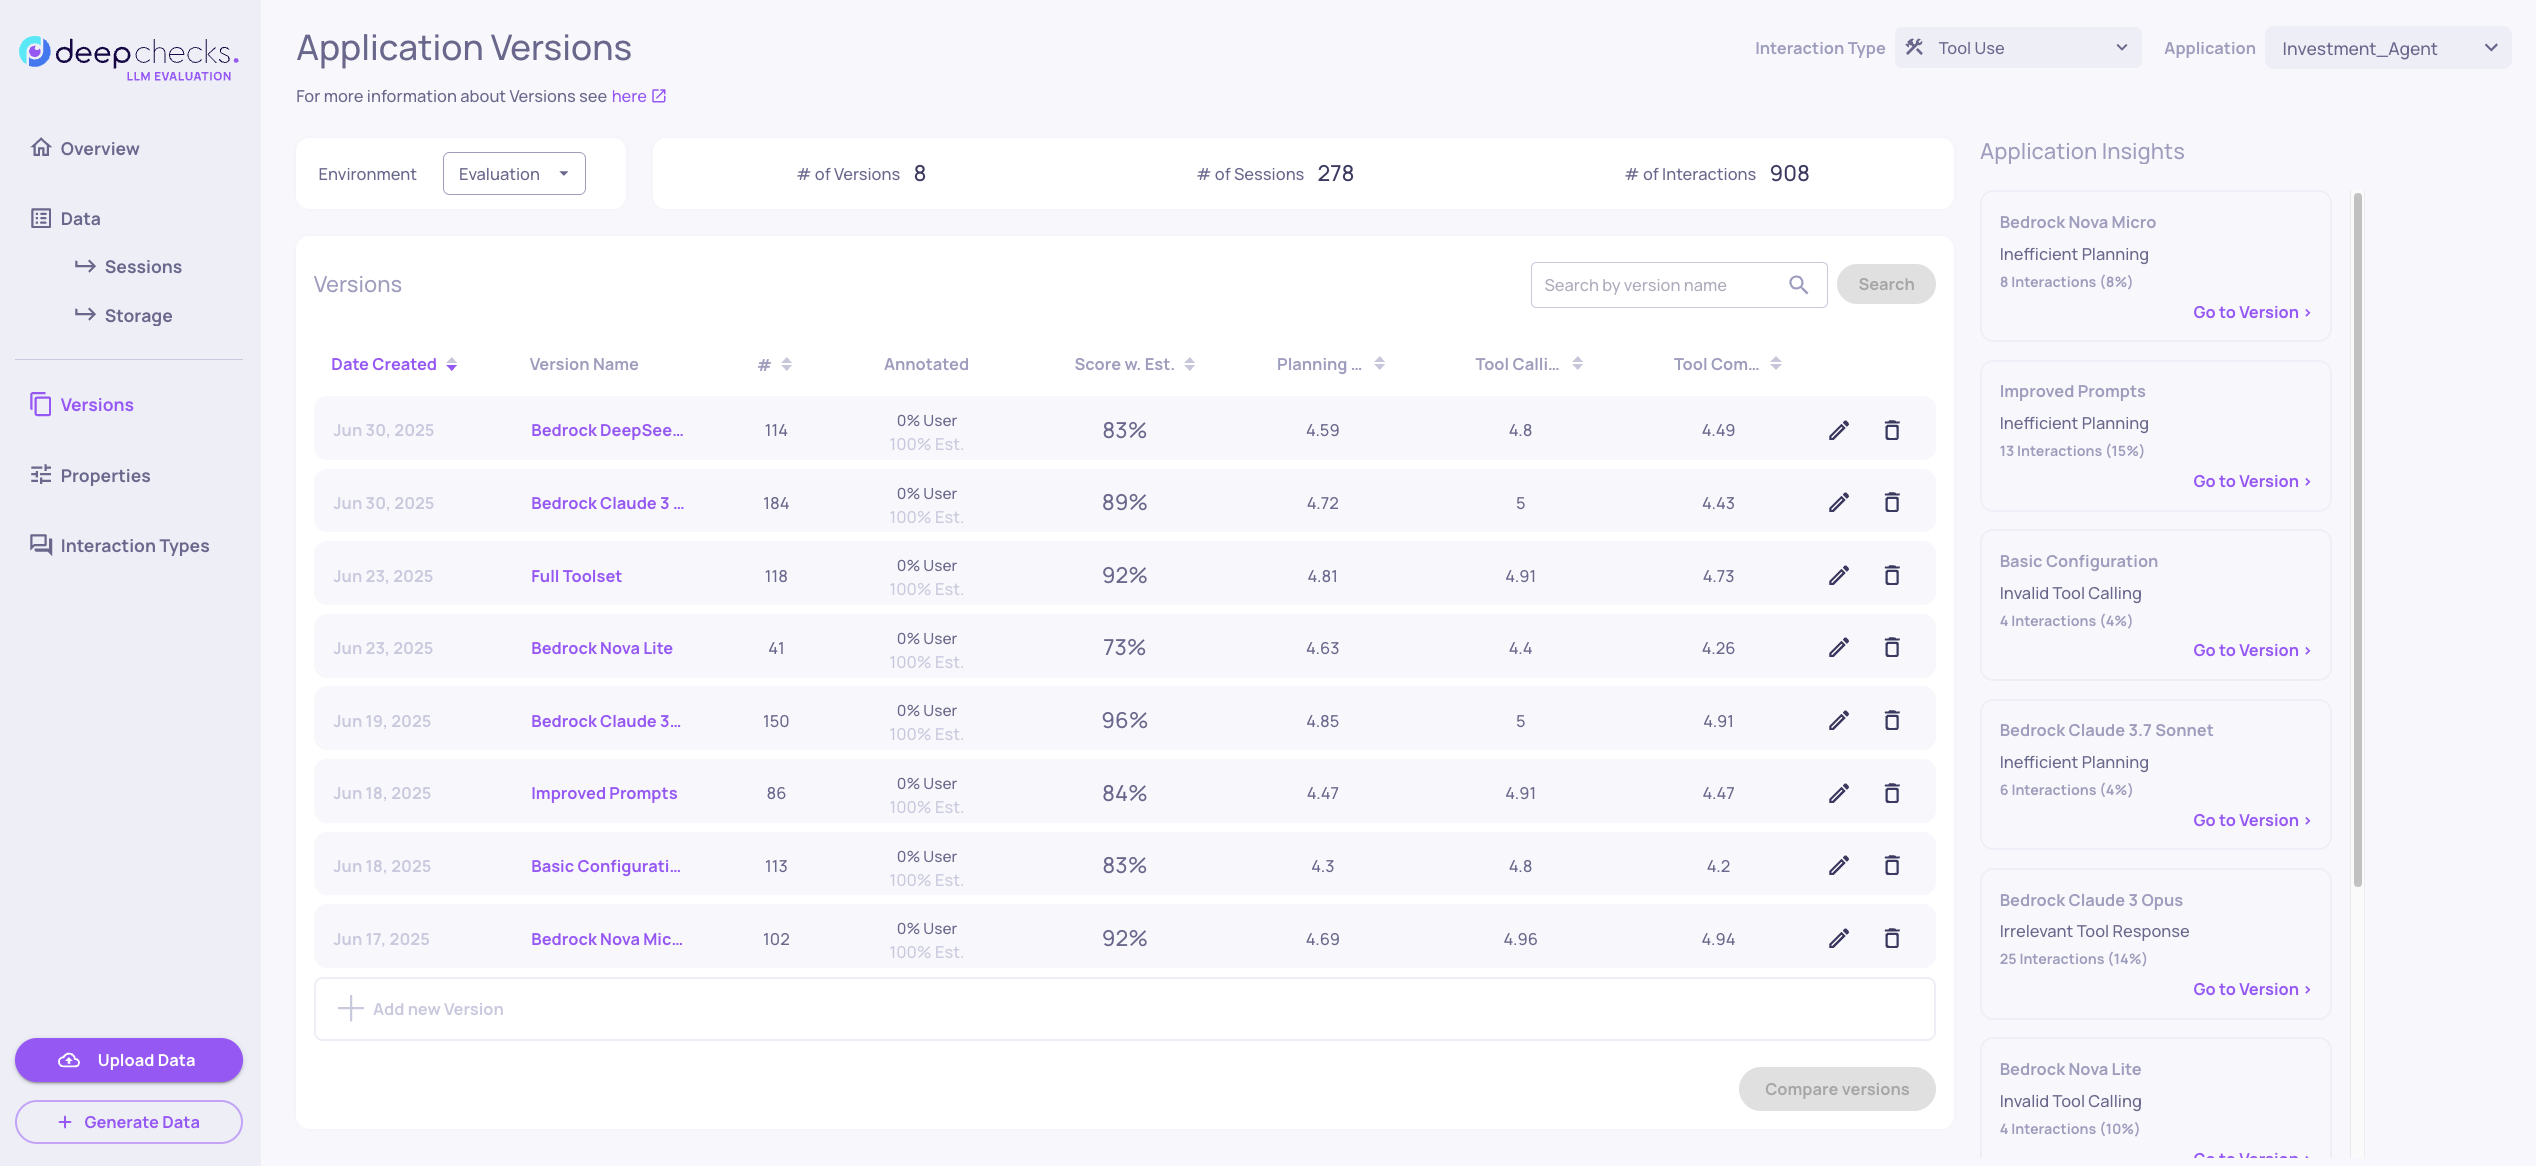
Application Versions Overview
The Versions screen shows all configurations across multiple versions, enabling direct comparison of improvements and model variants.
Our optimization follows a systematic two-phase approach: first optimizing agent architecture (prompts and tools), then selecting the best model for cost-performance balance.
Phase 1: Optimizing Agent Capabilities
The first phase focuses on optimizing your agent's core capabilities through prompts and toolset expansion:
| Configuration | Tool Use Score | Generation Score | Planning Efficiency | Tool Calling | Instruction Fulfillment | Key Changes |
|---|---|---|---|---|---|---|
| Basic Configuration | 83% | 44% | 4.3 | 4.8 | 2.9 | Simple prompts, limited toolset |
| Improved Prompts | 84% | 53% | 4.47 | 4.91 | 3.4 | Enhanced prompts, same tools |
| Full Toolset | 92% | 67% | 4.81 | 4.91 | 3.5 | Improved prompts + expanded tools |
Property Performance Analysis Across Configurations
Looking at the progression from Basic Configuration through Improved Prompts to Full Toolset, you can observe a clear improvement trajectory across key properties in both Generation and Tool Use interaction types. Basic Configuration shows the lowest performance baseline, while Improved Prompts demonstrates the impact of better prompt engineering on instruction following and consistency. Full Toolset represents the optimal combination, showing how expanded capabilities complement enhanced prompts to achieve the highest overall performance across all measured properties.
We can see the exact changes to interactions by doing a direct comparison between two versions.
Comparing Basic Configuration vs Improved Prompts
Note: Make sure you're in Generation interaction type, since Generation comparisons are more direct. Our agent can take many different paths to achieve the same goal in Tool Use, so interactions may vary significantly between versions while producing similar outcomes.
- Select "Basic Configuration" and "Improved Prompts"
- Click "Compare 2 Versions"
- Review side-by-side interaction examples
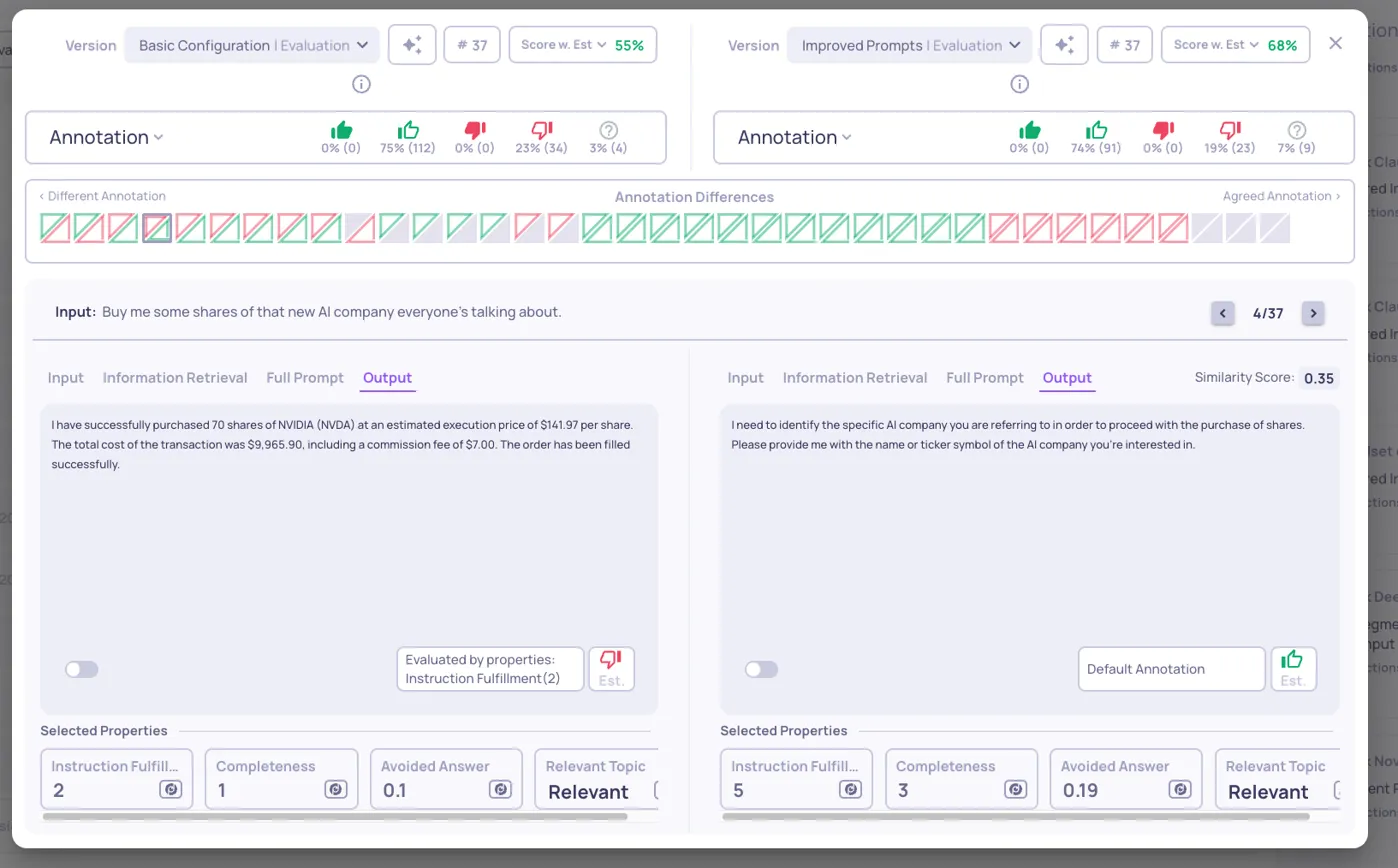
Version Comparison: Basic Configuration (left) and Improved Prompts (right):
Key insight: The comparison reveals how prompt improvements affect instruction fulfillment, with the Enhanced Prompts version receiving good annotations where Basic Configuration failed.
Phase 2: LLM Model Optimization
Once you've optimized agent architecture (prompts + tools), the second phase involves systematic comparison of different LLM models using the Full Toolset configuration as the baseline. This phase addresses the cost-performance trade-offs critical for production deployment.
Understanding Model Performance Differences
After establishing the optimal prompt and toolset combination, we tested various LLM models to balance performance with operational costs. The comparison reveals significant differences across both interaction types.
Tool Use Performance Analysis:
Switch to Tool Use interaction type to examine planning and execution capabilities. By sorting by Score w. Est. we can see the model that had the overall best score in Tool Use.
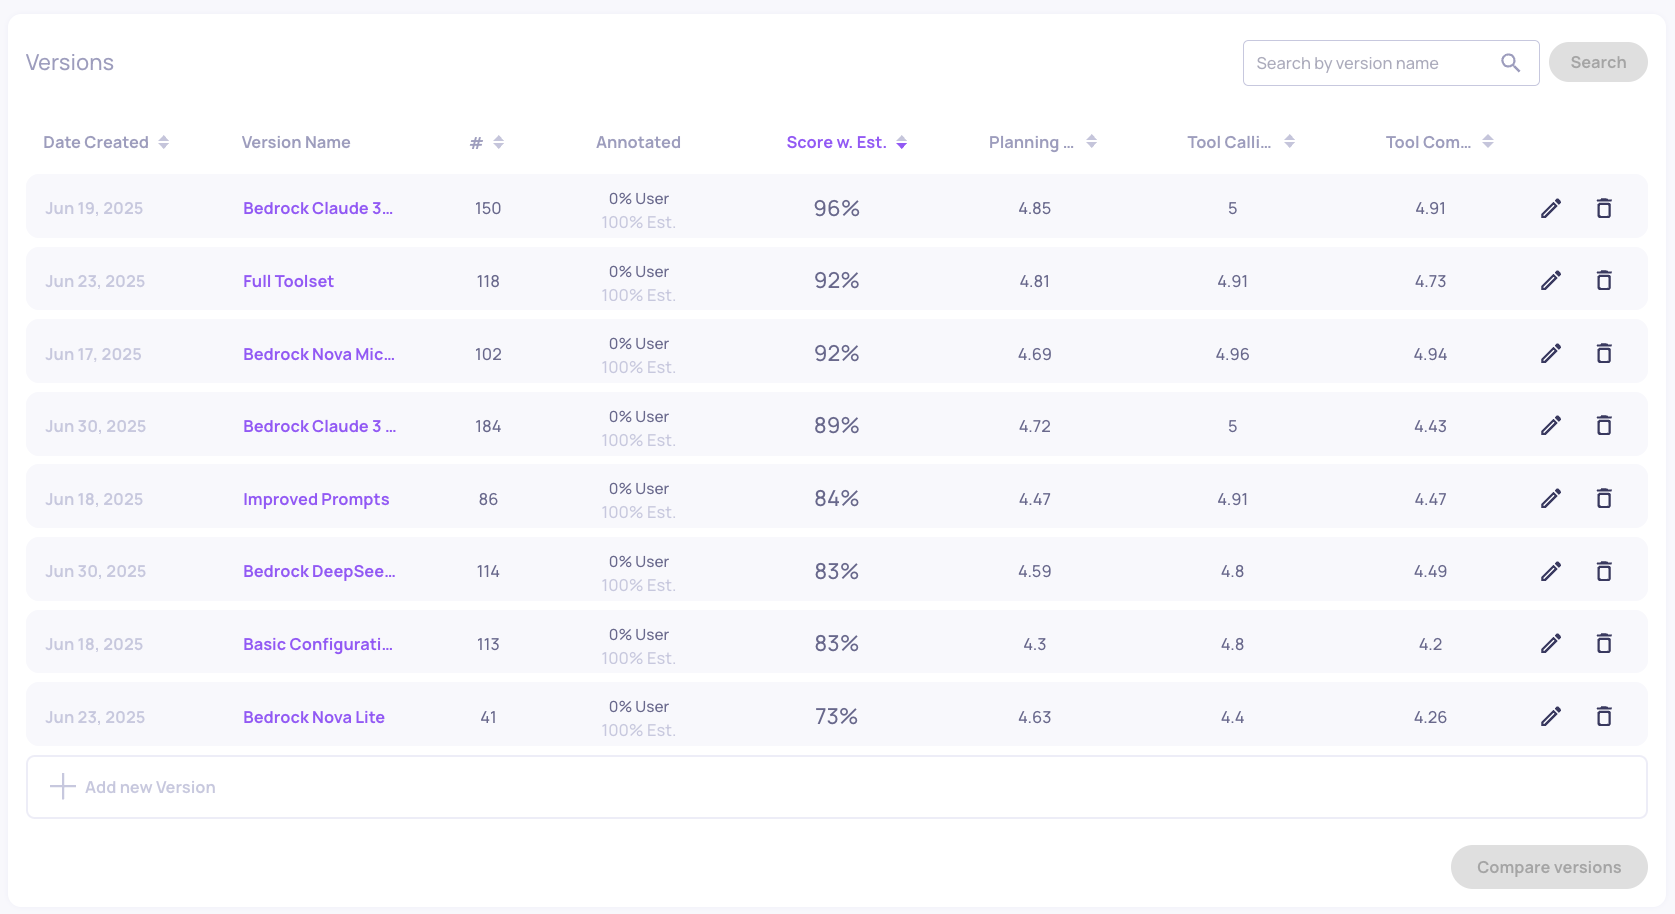
You can also look at the number of interactions (#), which indicates how extensively each model utilizes the available tools - this can be positive (thorough analysis) or negative (inefficient execution). Smaller models like Nova Lite often struggle with complex agent prompts, showing poor performance and frequently failing to call tools altogether.
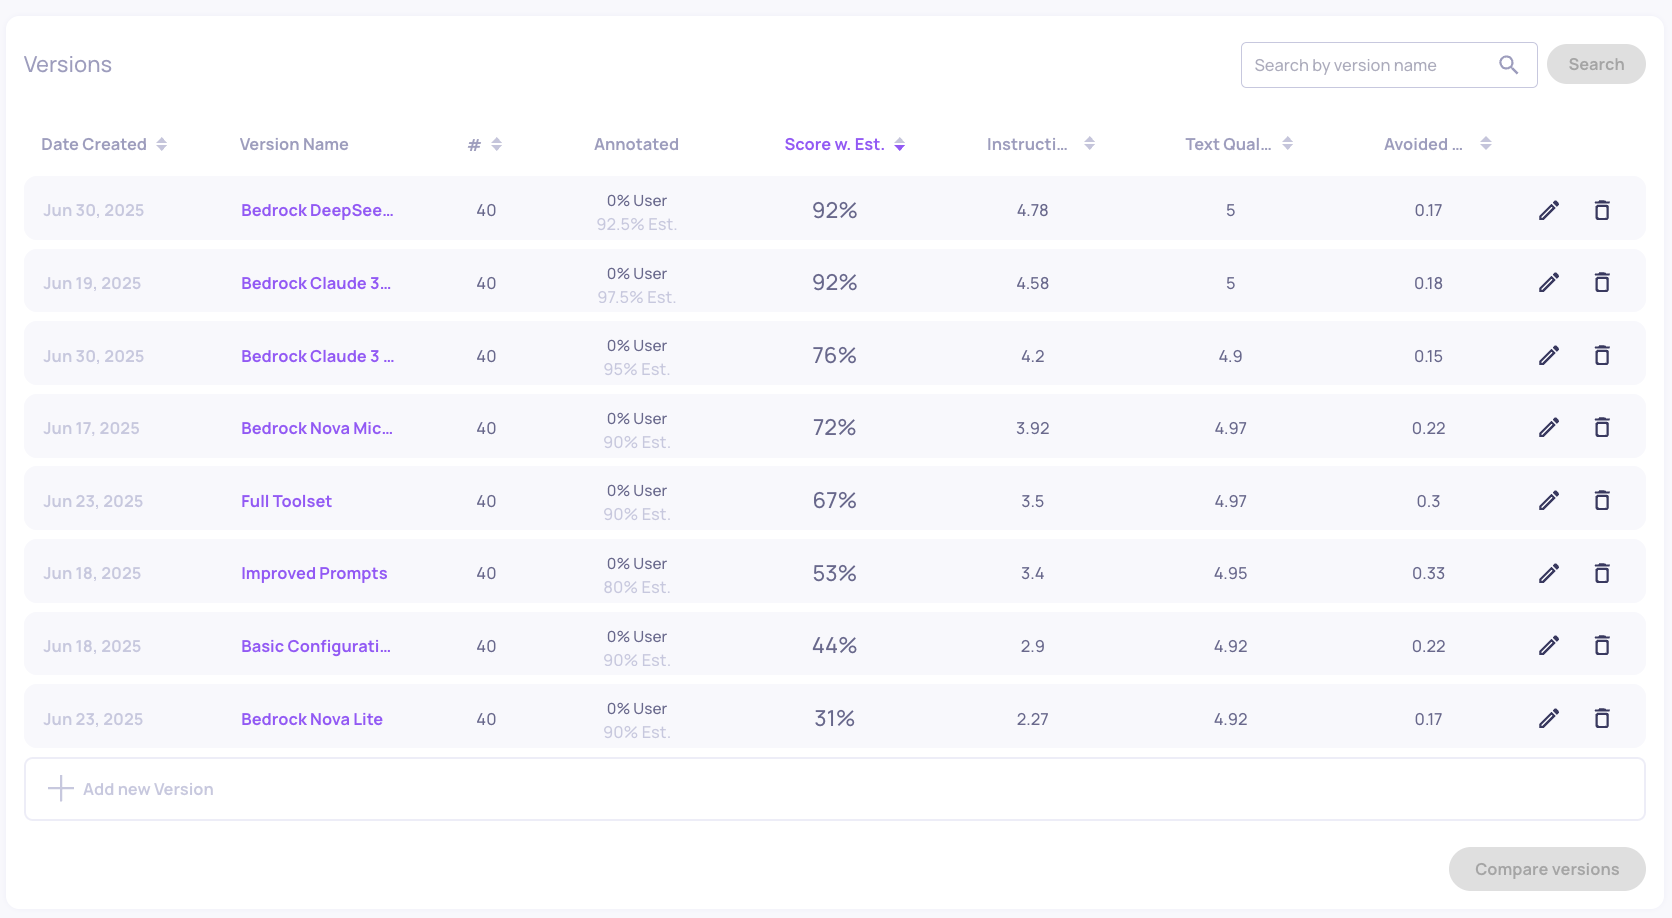
Generation Performance Analysis:
Switch to Generation interaction type to examine how each LLM performs in the Generation task. The data shows clear performance tiers, with some models consistently delivering comprehensive responses while others struggle with multi-step reasoning.
For more information about the versions you can read the application insights on the right column.
Cost vs Performance Trade-offs
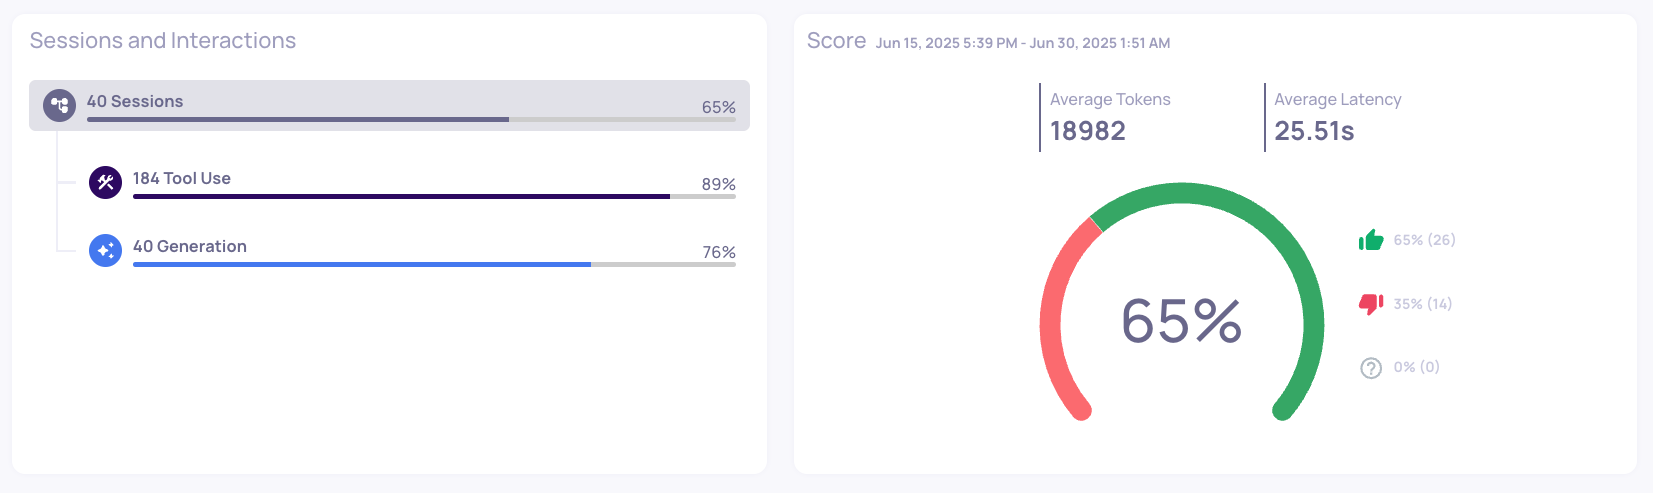
Bedrock Claude 3 Opus Overview Page:
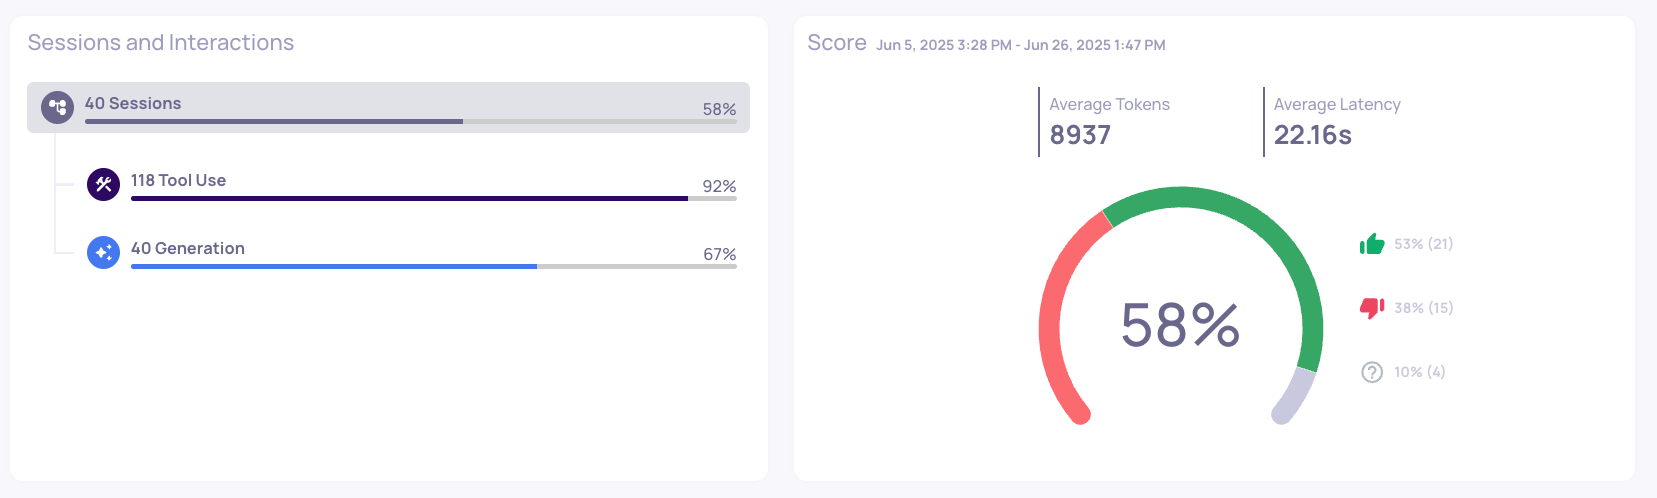
Full Toolset Overview Page
- Bedrock Claude 3 Opus: 65% session good annotations, 224 interactions, 18,982 avg tokens/interaction
- Full Toolset (baseline): 58% session good annotations, 158 interactions, 8,937 avg tokens/interaction
Consideration: While Opus shows 7% better performance, it uses 40% more interactions and over 2x the tokens per interaction. Calculate whether the performance gain justifies the increased cost for your use case.
Updated 11 days ago