Threshold Detection
The goal is to find a threshold that separates problematic outputs from acceptable ones. Ideally, outputs with issues in the targeted aspect should score below this threshold, while making sure that low-scoring samples truly deserve a "bad" label. This helps optimize both precision and recall for the negative class.
If a single threshold doesn’t strike the right balance, use a dual-threshold approach: outputs below the lower threshold are labeled as "bad," those above the upper threshold as "good," and scores in between remain unlabeled for manual review.
Using a Manually Annotated DataWhile not required, having even a small set of annotated data can significantly speed up the process of finding an optimal threshold. The subset should include both high-quality outputs and examples with issues in the relevant property.
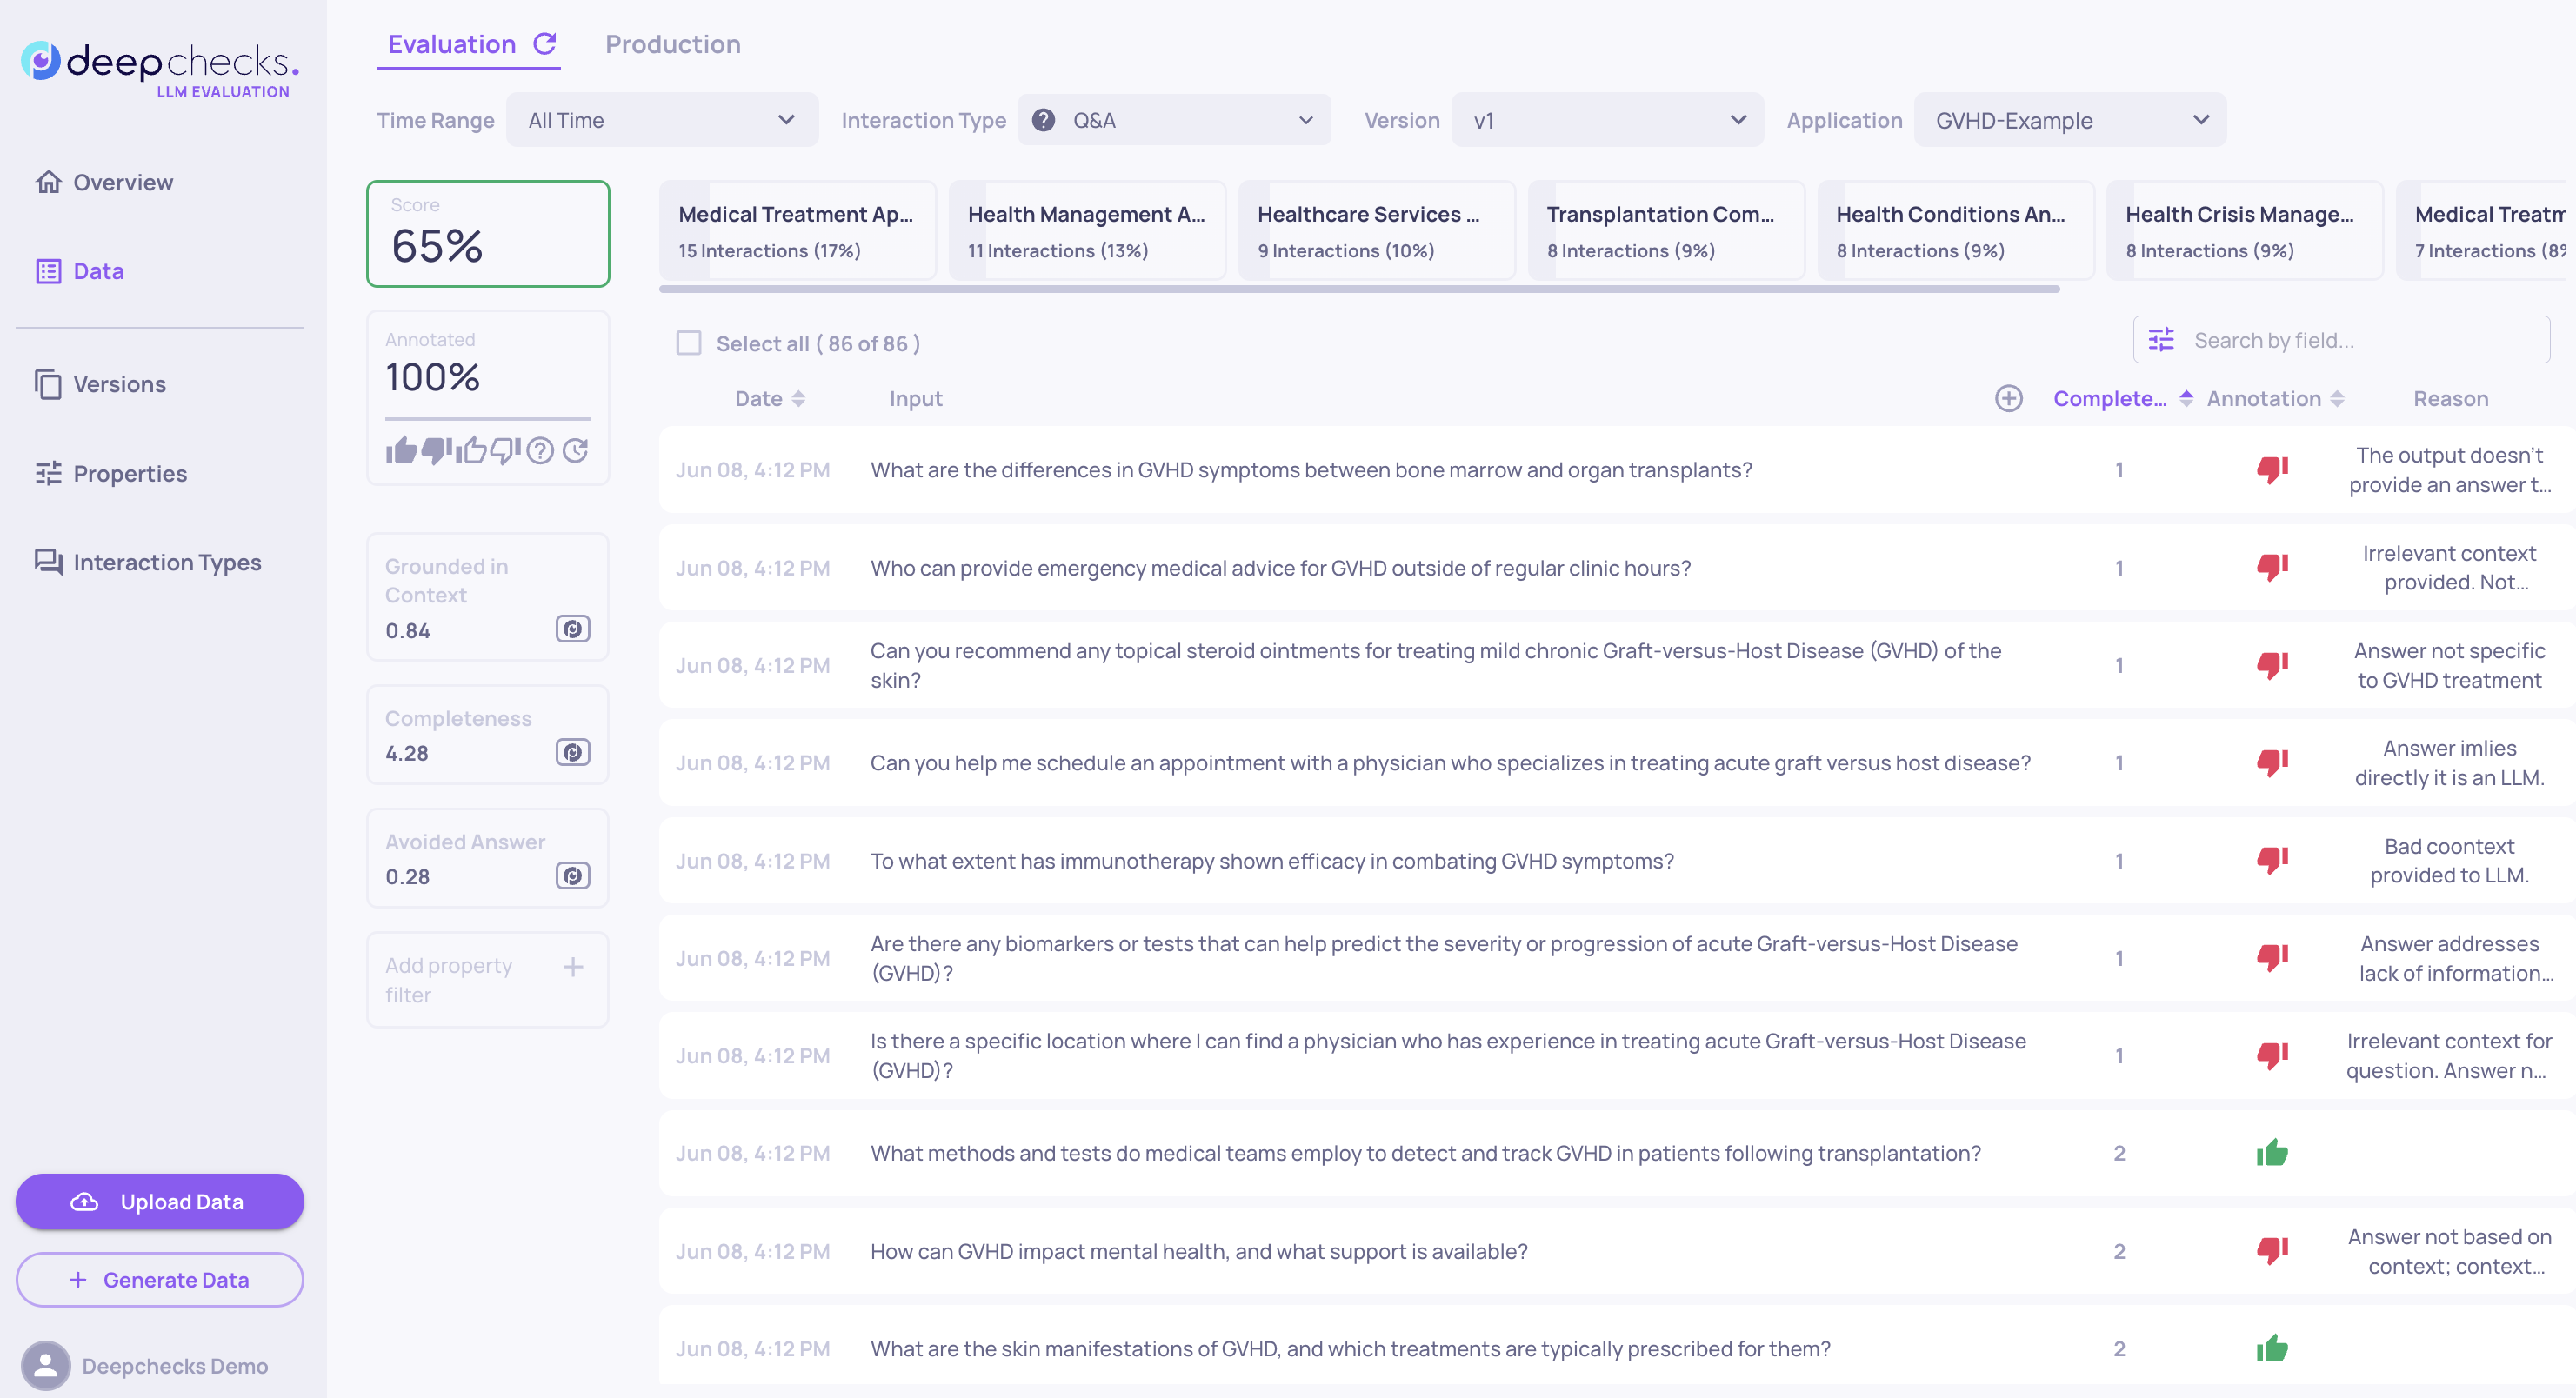
To identify effective thresholds, go to the Interactions page and sort by the relevant property score. This lets you visually compare scores with manual labels, helping you understand how well the property aligns with the relevant aspect and overall quality. In the sorted view in the Interactions page:
- Spot natural breakpoints where the output quality shifts, from mostly "bad" to mixed, as scores rise.
- Confirm that low scores reflect actual problems in the relevant aspect.
- Catch mismatches where high scores still appear alongside problematic outputs, which may suggest the property needs tuning.
This visual process helps you choose thresholds that meaningfully separate weak outputs from strong ones. If no clear threshold appears, refine the property guidelines or double-check that the underlying data is correctly populated.