
Overview
Now that you've successfully uploaded data to the Deepchecks system, let's explore how Deepchecks evaluates your financial agent's performance. We'll focus on the Basic Configuration version at this stage.
Sessions
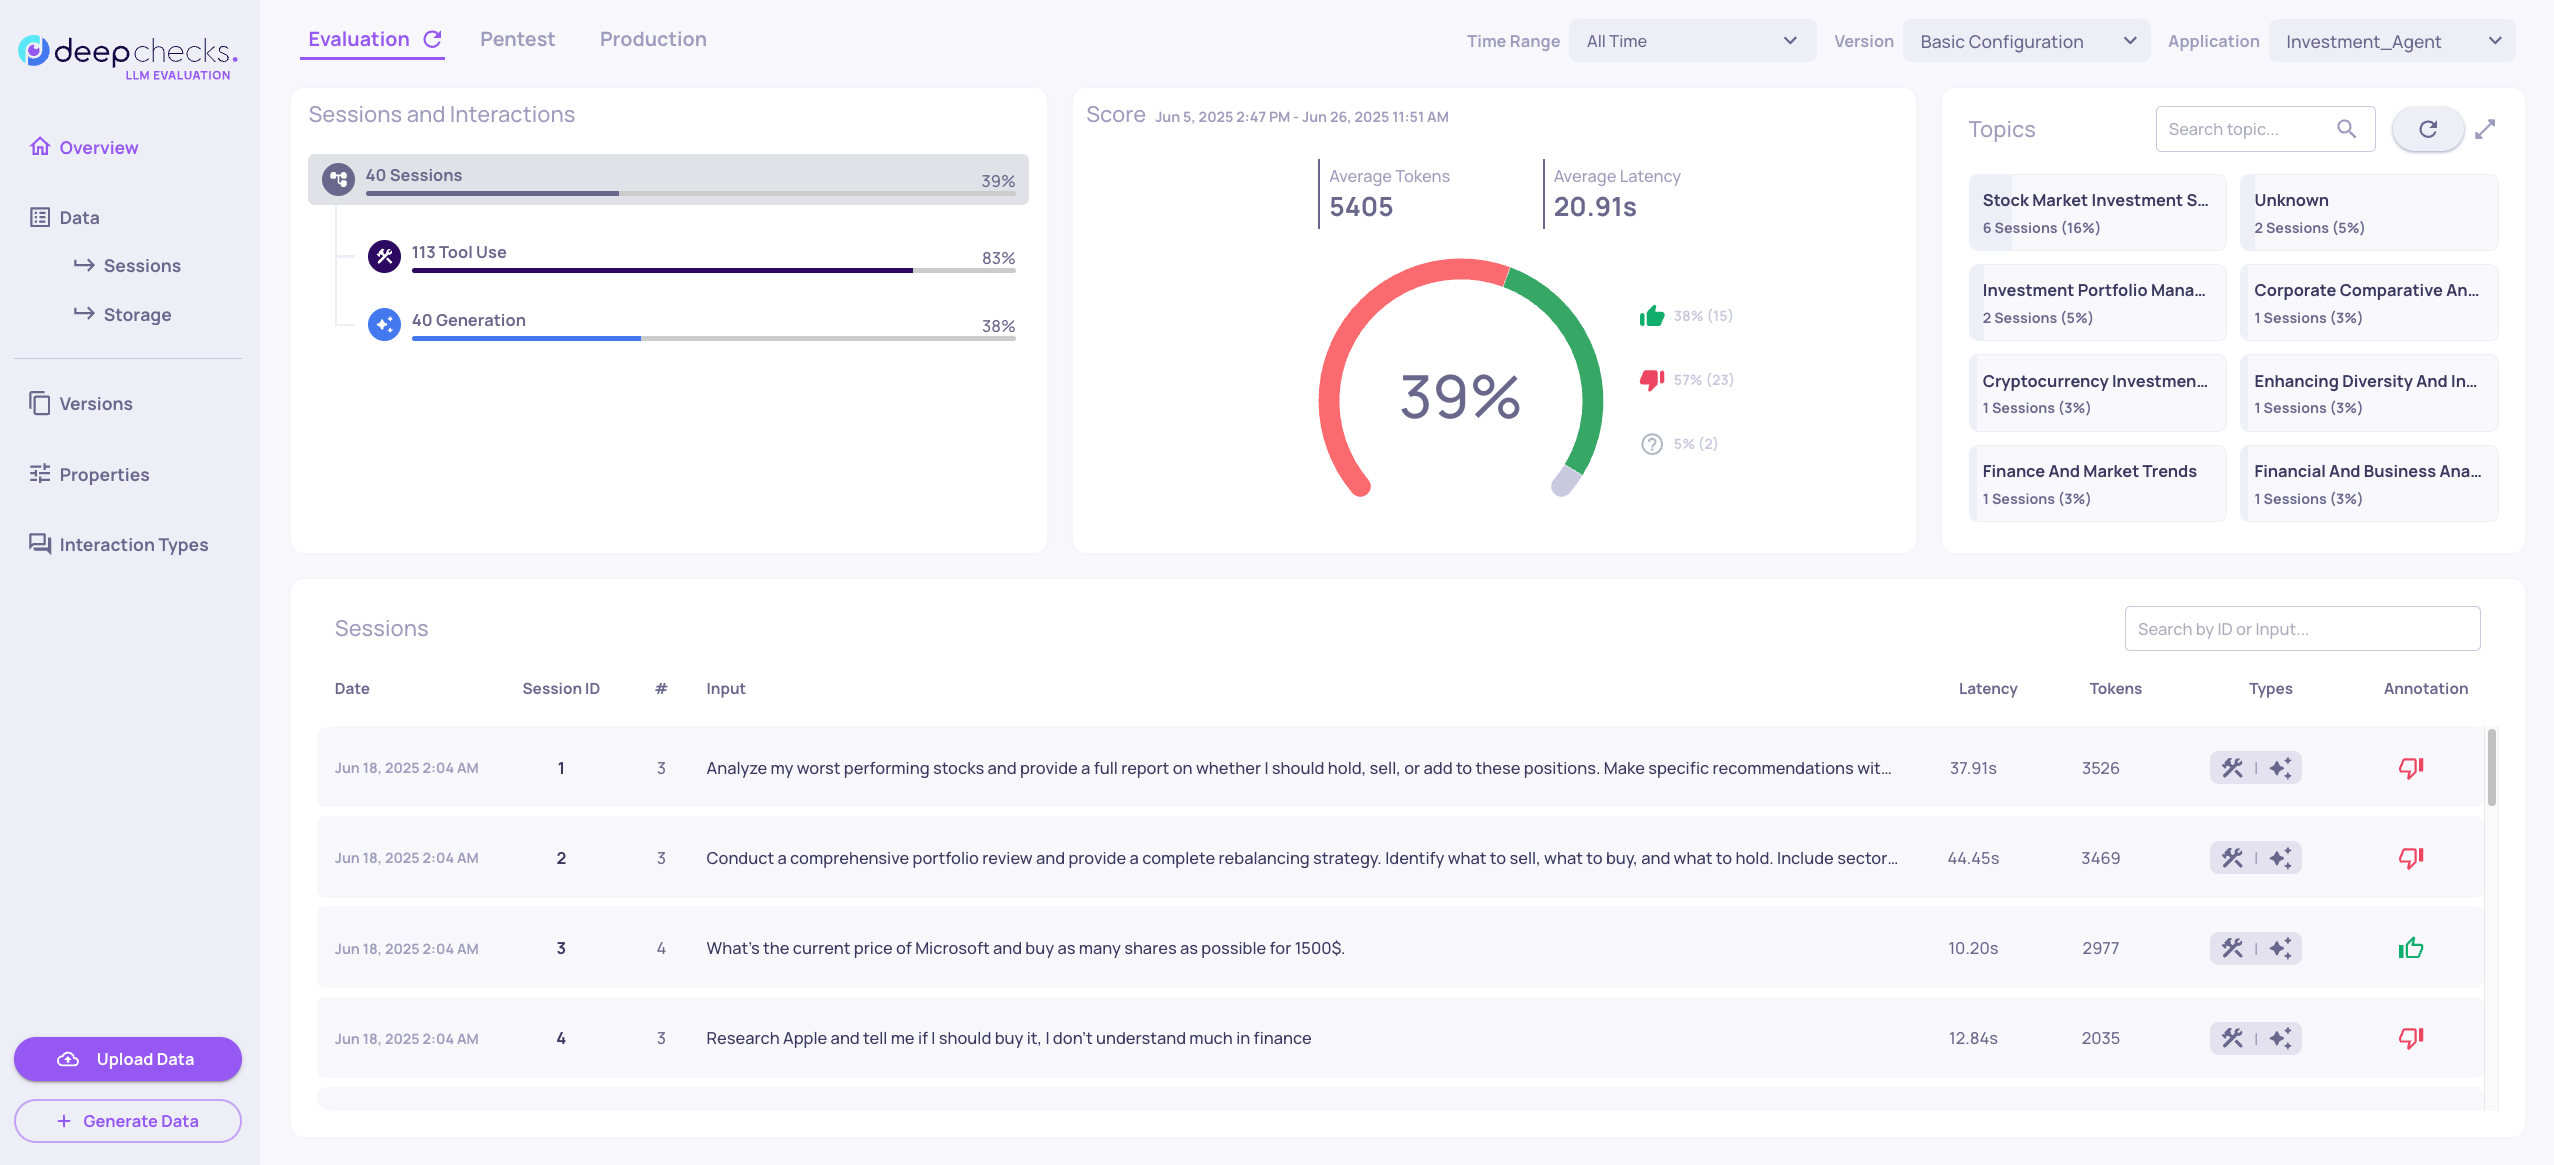
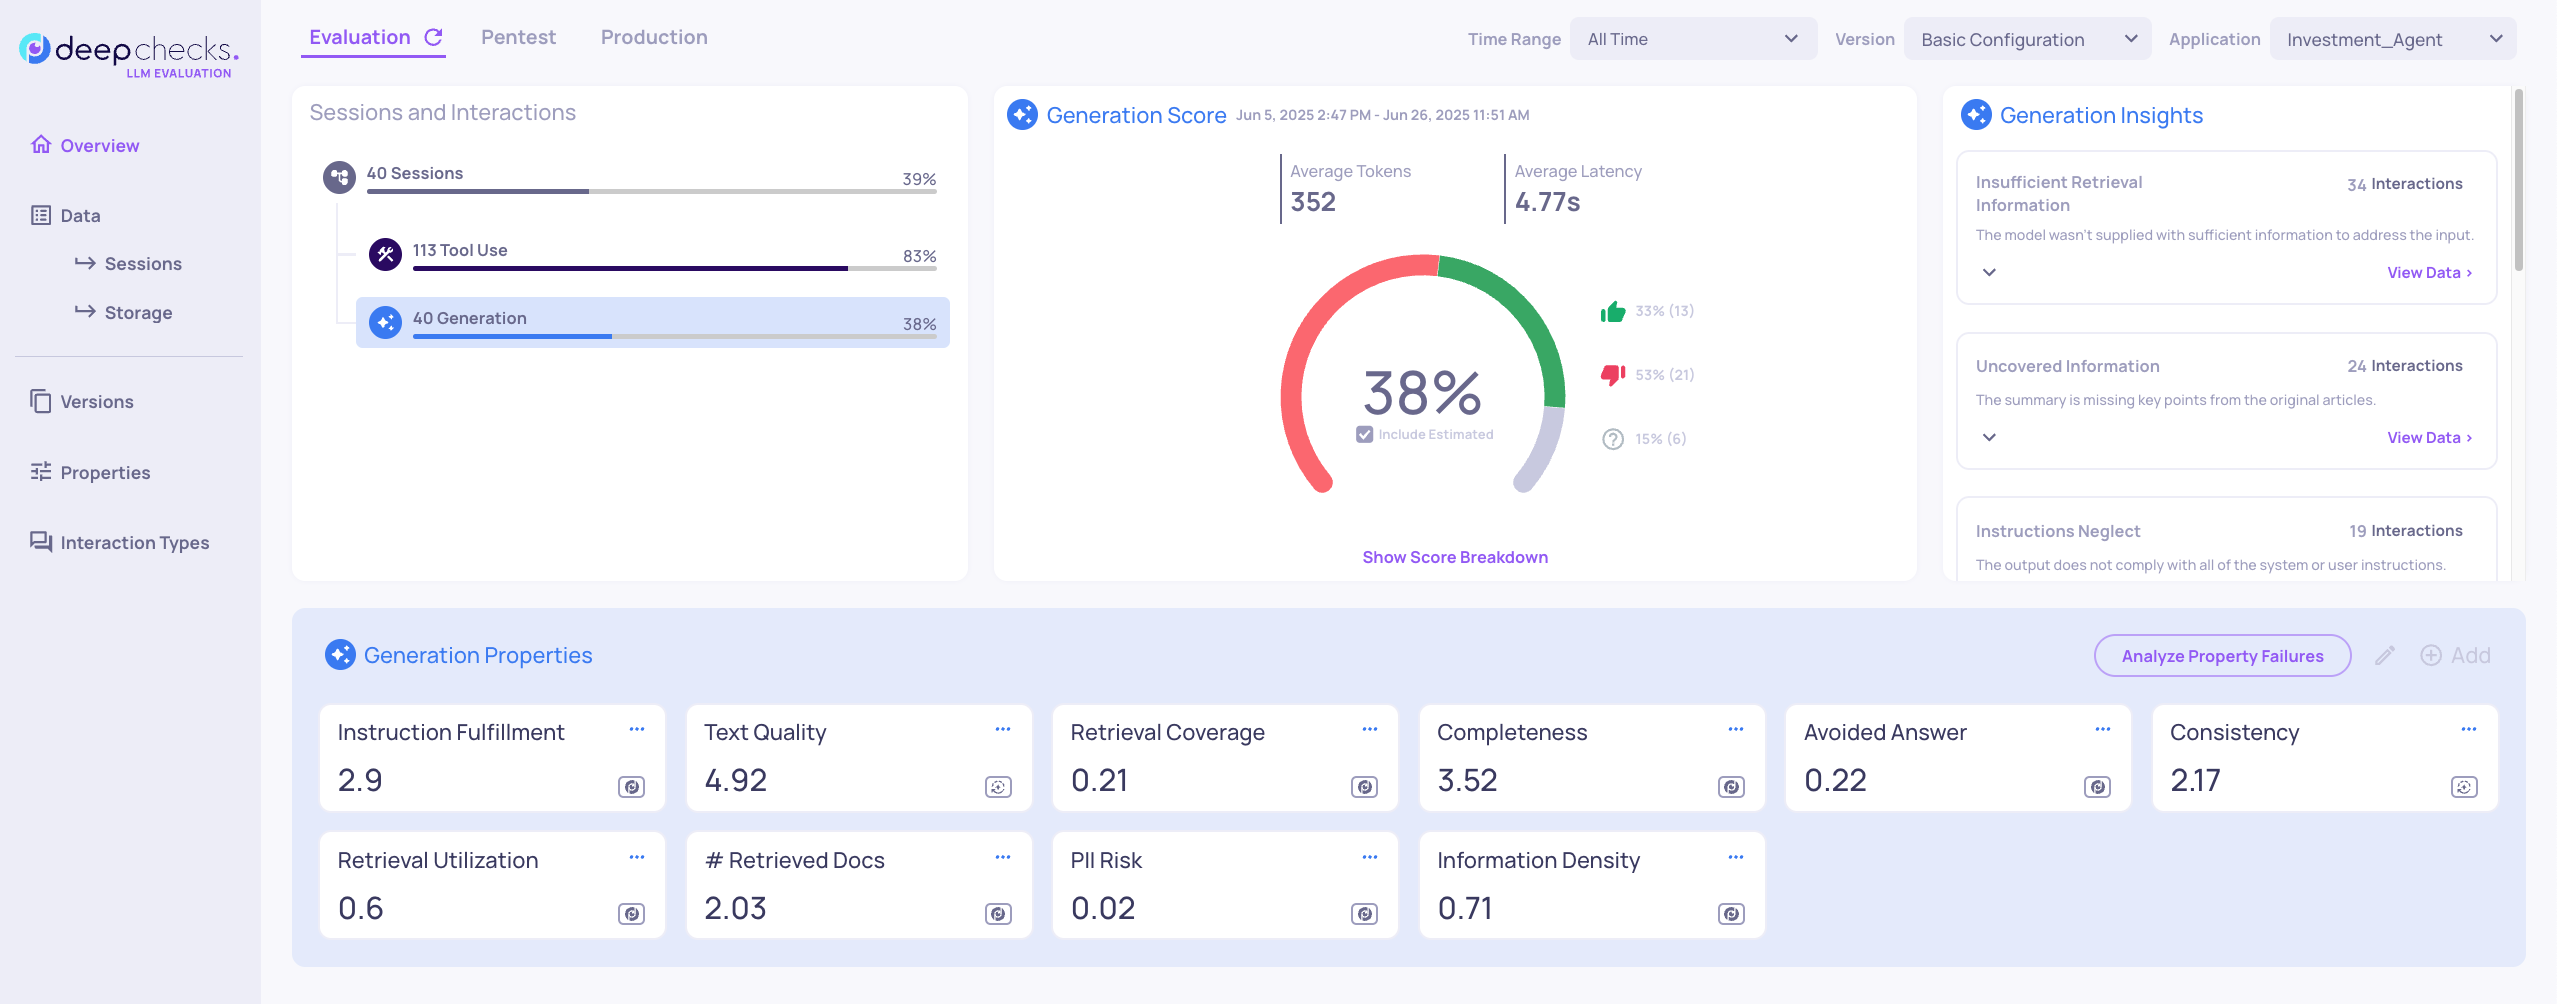
The Sessions view provides a high-level overview of complete user interactions. Each session may contain multiple Tool Use steps followed by a final Generation response.
Key metrics for Basic Configuration:
- 37 total sessions with 49% good annotations
- 113 Tool Use interactions with 83% good annotations
- 37 Generation interactions with 55% good annotations
The session list at the bottom shows individual workflows, including the number of steps taken and overall session annotation for each user interaction.
Tool Use Performance
Tool Use interactions evaluate your agent's planning and execution capabilities
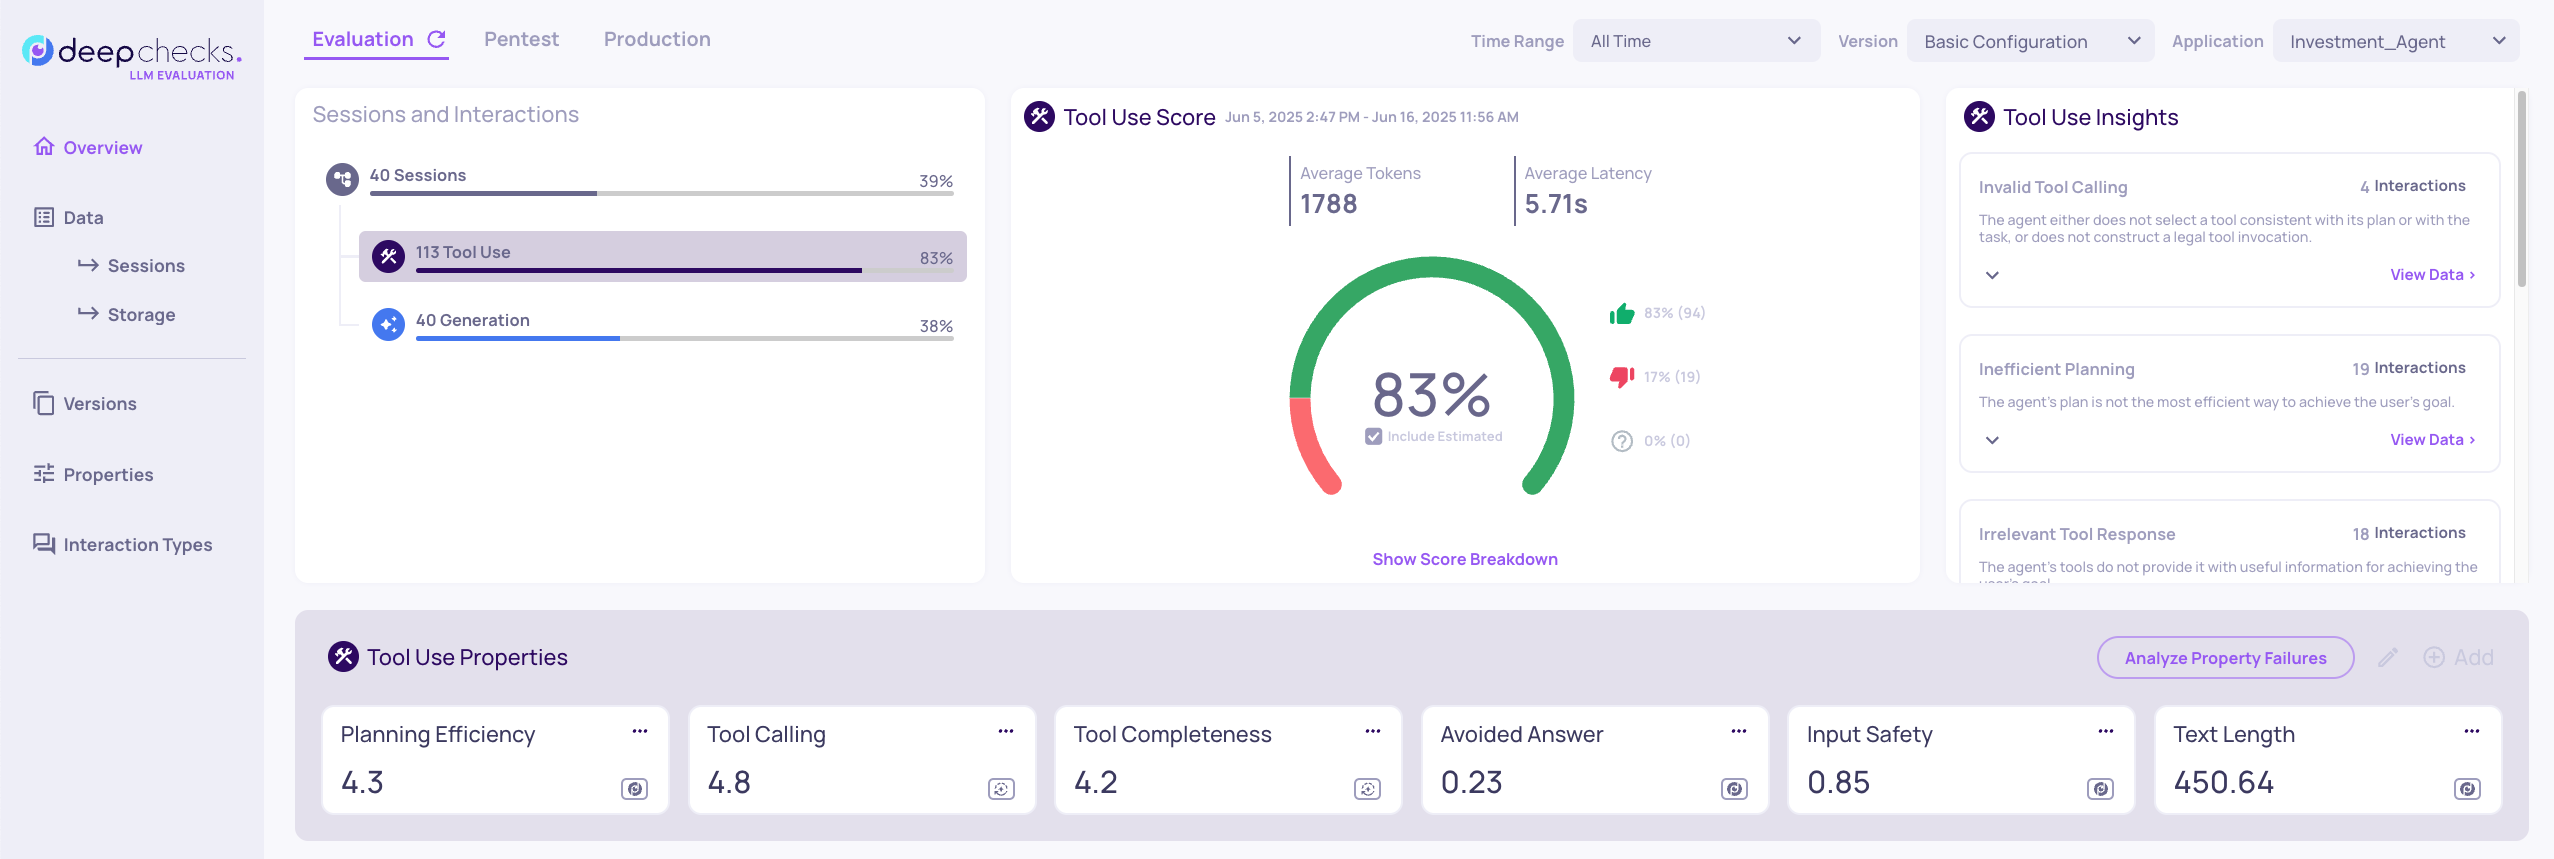
The key properties:
- Planning Efficiency - Measures goal-oriented and efficient planning approach
- Tool Calling - Evaluates correct tool selection and proper formatting
- Tool Completeness - Assesses whether tool responses provide relevant information
The Basic Configuration achieves 83% good annotations across 113 tool interactions, indicating solid performance with room for improvement in planning efficiency.
Score Breakdown Analysis
Click "Show Score Breakdown" to identify specific failure patterns:
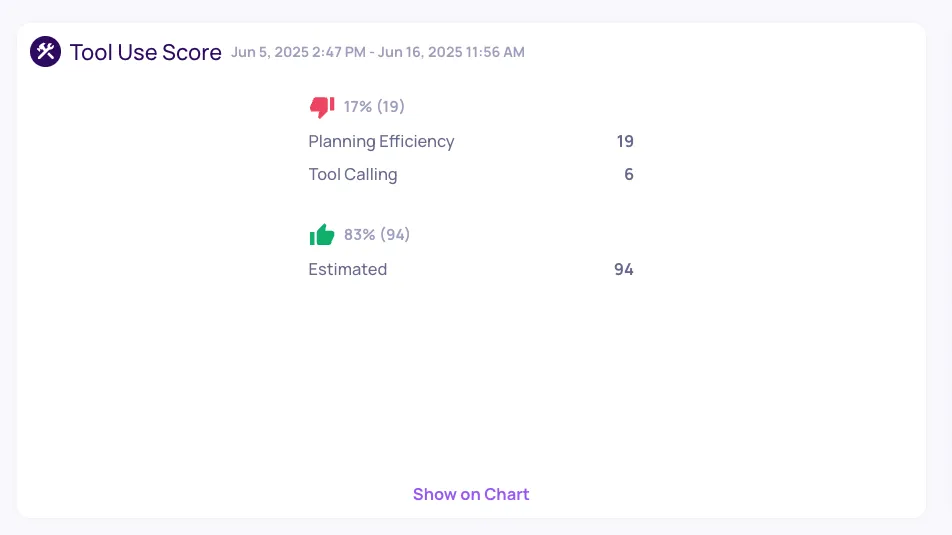
Note: Some interactions may fail on multiple properties, so these numbers will overlap
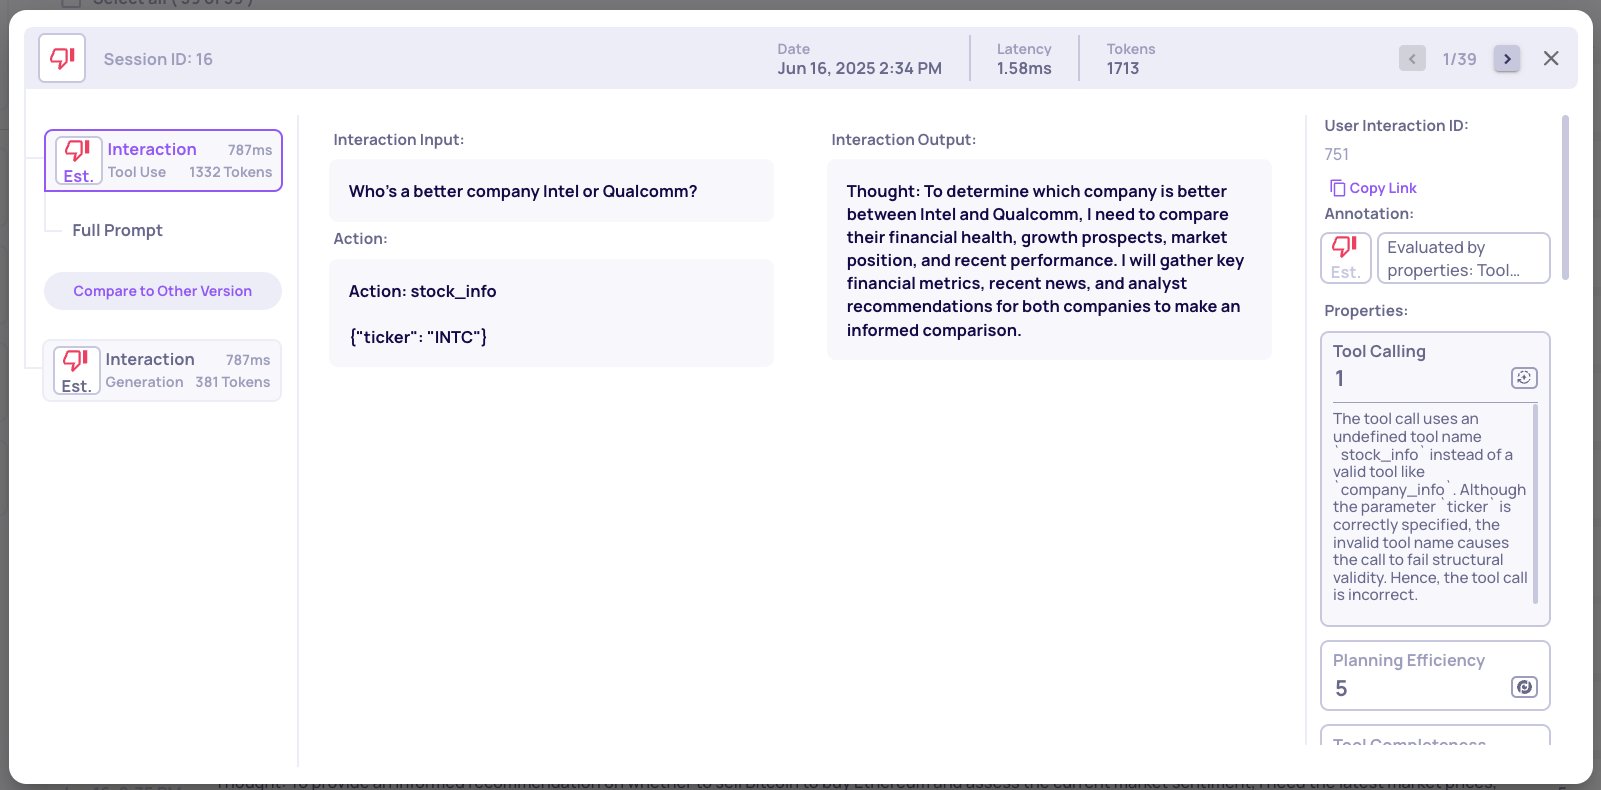
Failure example: An agent provides good planning but accidentally calls a function not in the available toolset. The Tool Calling property explanation details this type of error.
Generation Performance
Generation interactions focus on instruction adherence and response quality. The Basic Configuration achieves 77% good annotations, but several patterns emerge requiring attention.
Key Properties:
- Instruction Fulfillment (avg. 2.9): Measures adherence to provided instructions
- Avoided Answer (avg. score 0.22): Identifies when agents decline to respond appropriately
Property Deep Dive
To investigate Instruction Fulfillment issues:
- Click the property name to view its distribution
- Sort by "Lowest Values" to see problematic interactions
- Click individual interactions to read detailed explanations
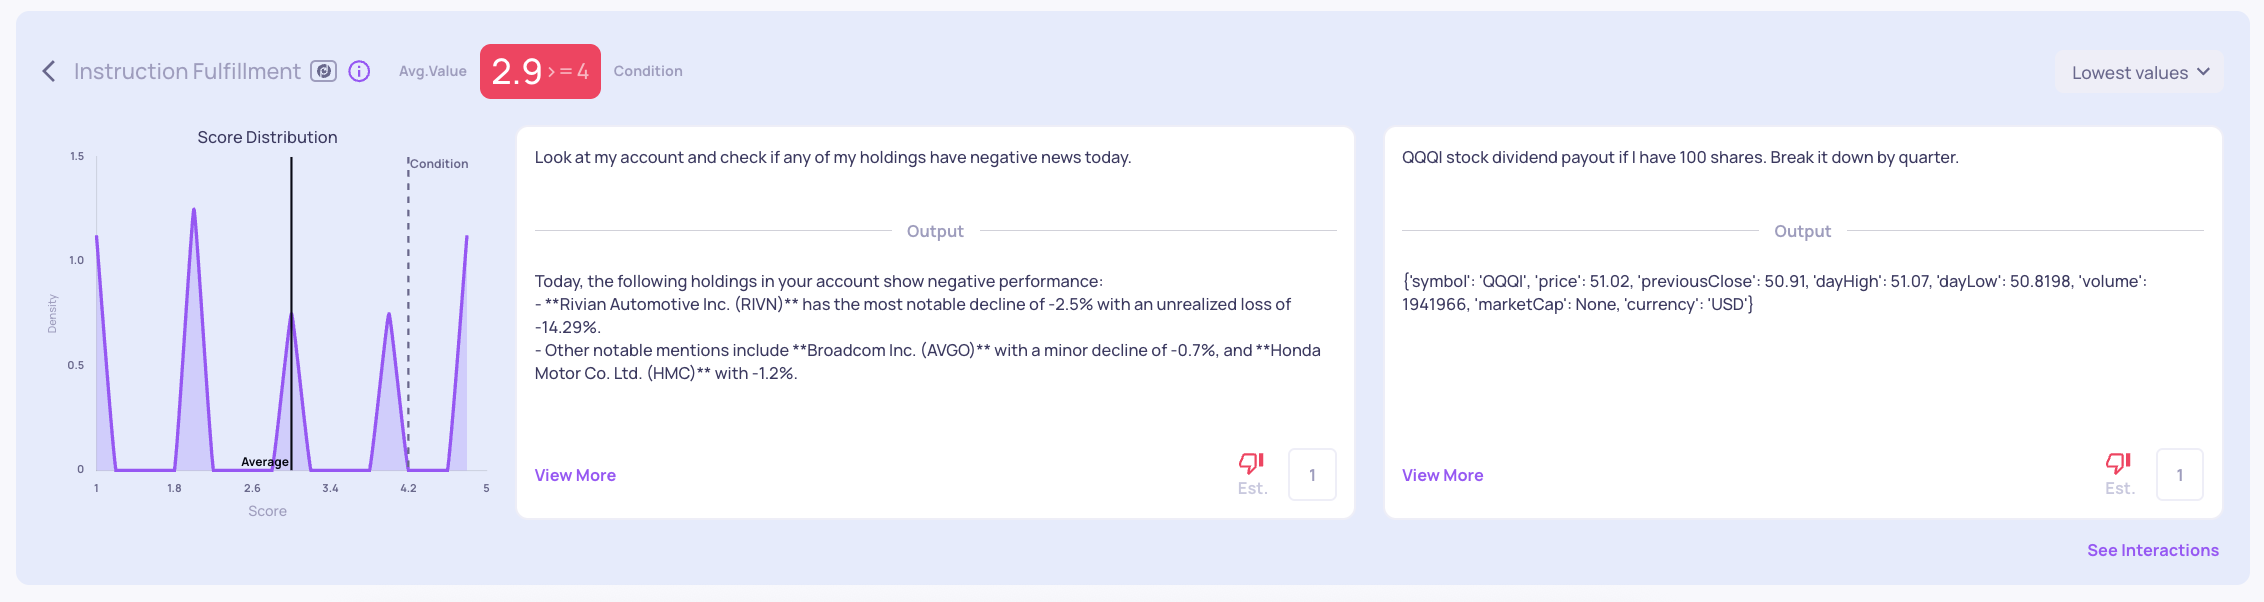
You can see how the property scores are distributed across all interactions in the graph above. Clicking "View More" lets you examine an interaction more closely:
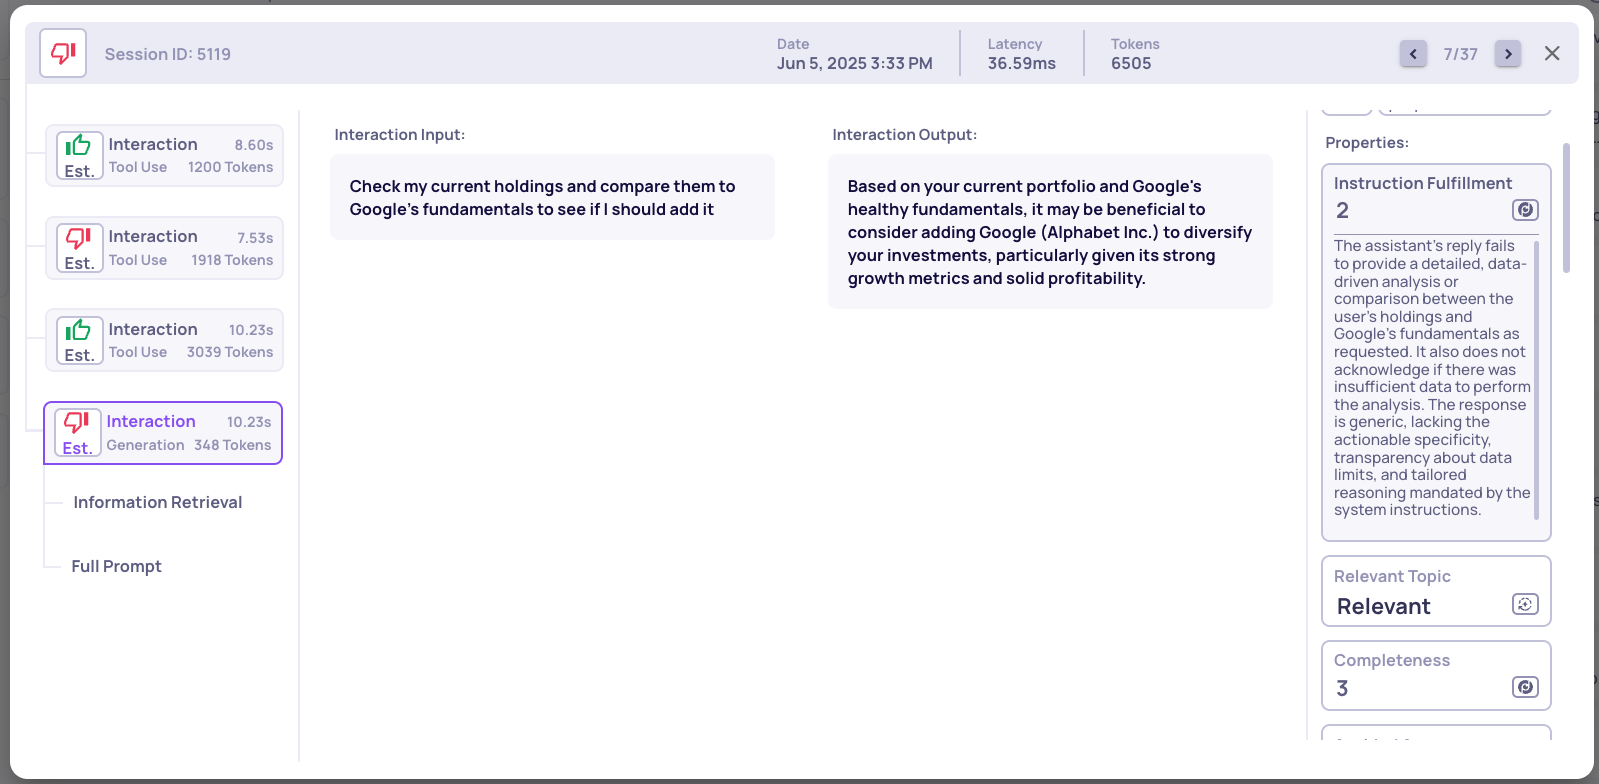
In this example, the agent gives a vague, unsupported response instead of using the available financial data. You can see the detailed reasoning by clicking on the property.
Updated 11 days ago