System Metrics
How to upload, view and use system metrics in the Deepchecks platform
Deepchecks supports uploading and displaying system metrics alongside the interactions' and sessions' data fields. This allows users to evaluate not only the quality of outputs, but also to track operational performance metrics — such as latency, token usage, and more. system metrics are a core part of the evaluation process, helping teams assess both the quality and efficiency of their LLM pipelines.
What are System Metrics?
System metrics refer to metadata that captures how each interaction was processed. While evaluation focuses on the quality of outputs, system metrics provide insight into performance and resource consumption.
Currently, Deepchecks supports the following metrics at the interaction and session levels:
Latency
Users can provide the start and end time of each interaction. Deepchecks calculates and displays the total latency (duration in second).
Token Usage
Users can provide the total number of tokens used for each interaction - covering all sources, such as input, output, reasoning, or others. Deepchecks stores and displays this aggregated token count. If no token data is provided, Deepchecks automatically estimates it by parsing the interaction content.
Metadata
Users can attach any custom key:value metadata related to system metrics via the SDK. This is useful for logging details such as cost, run status and more.
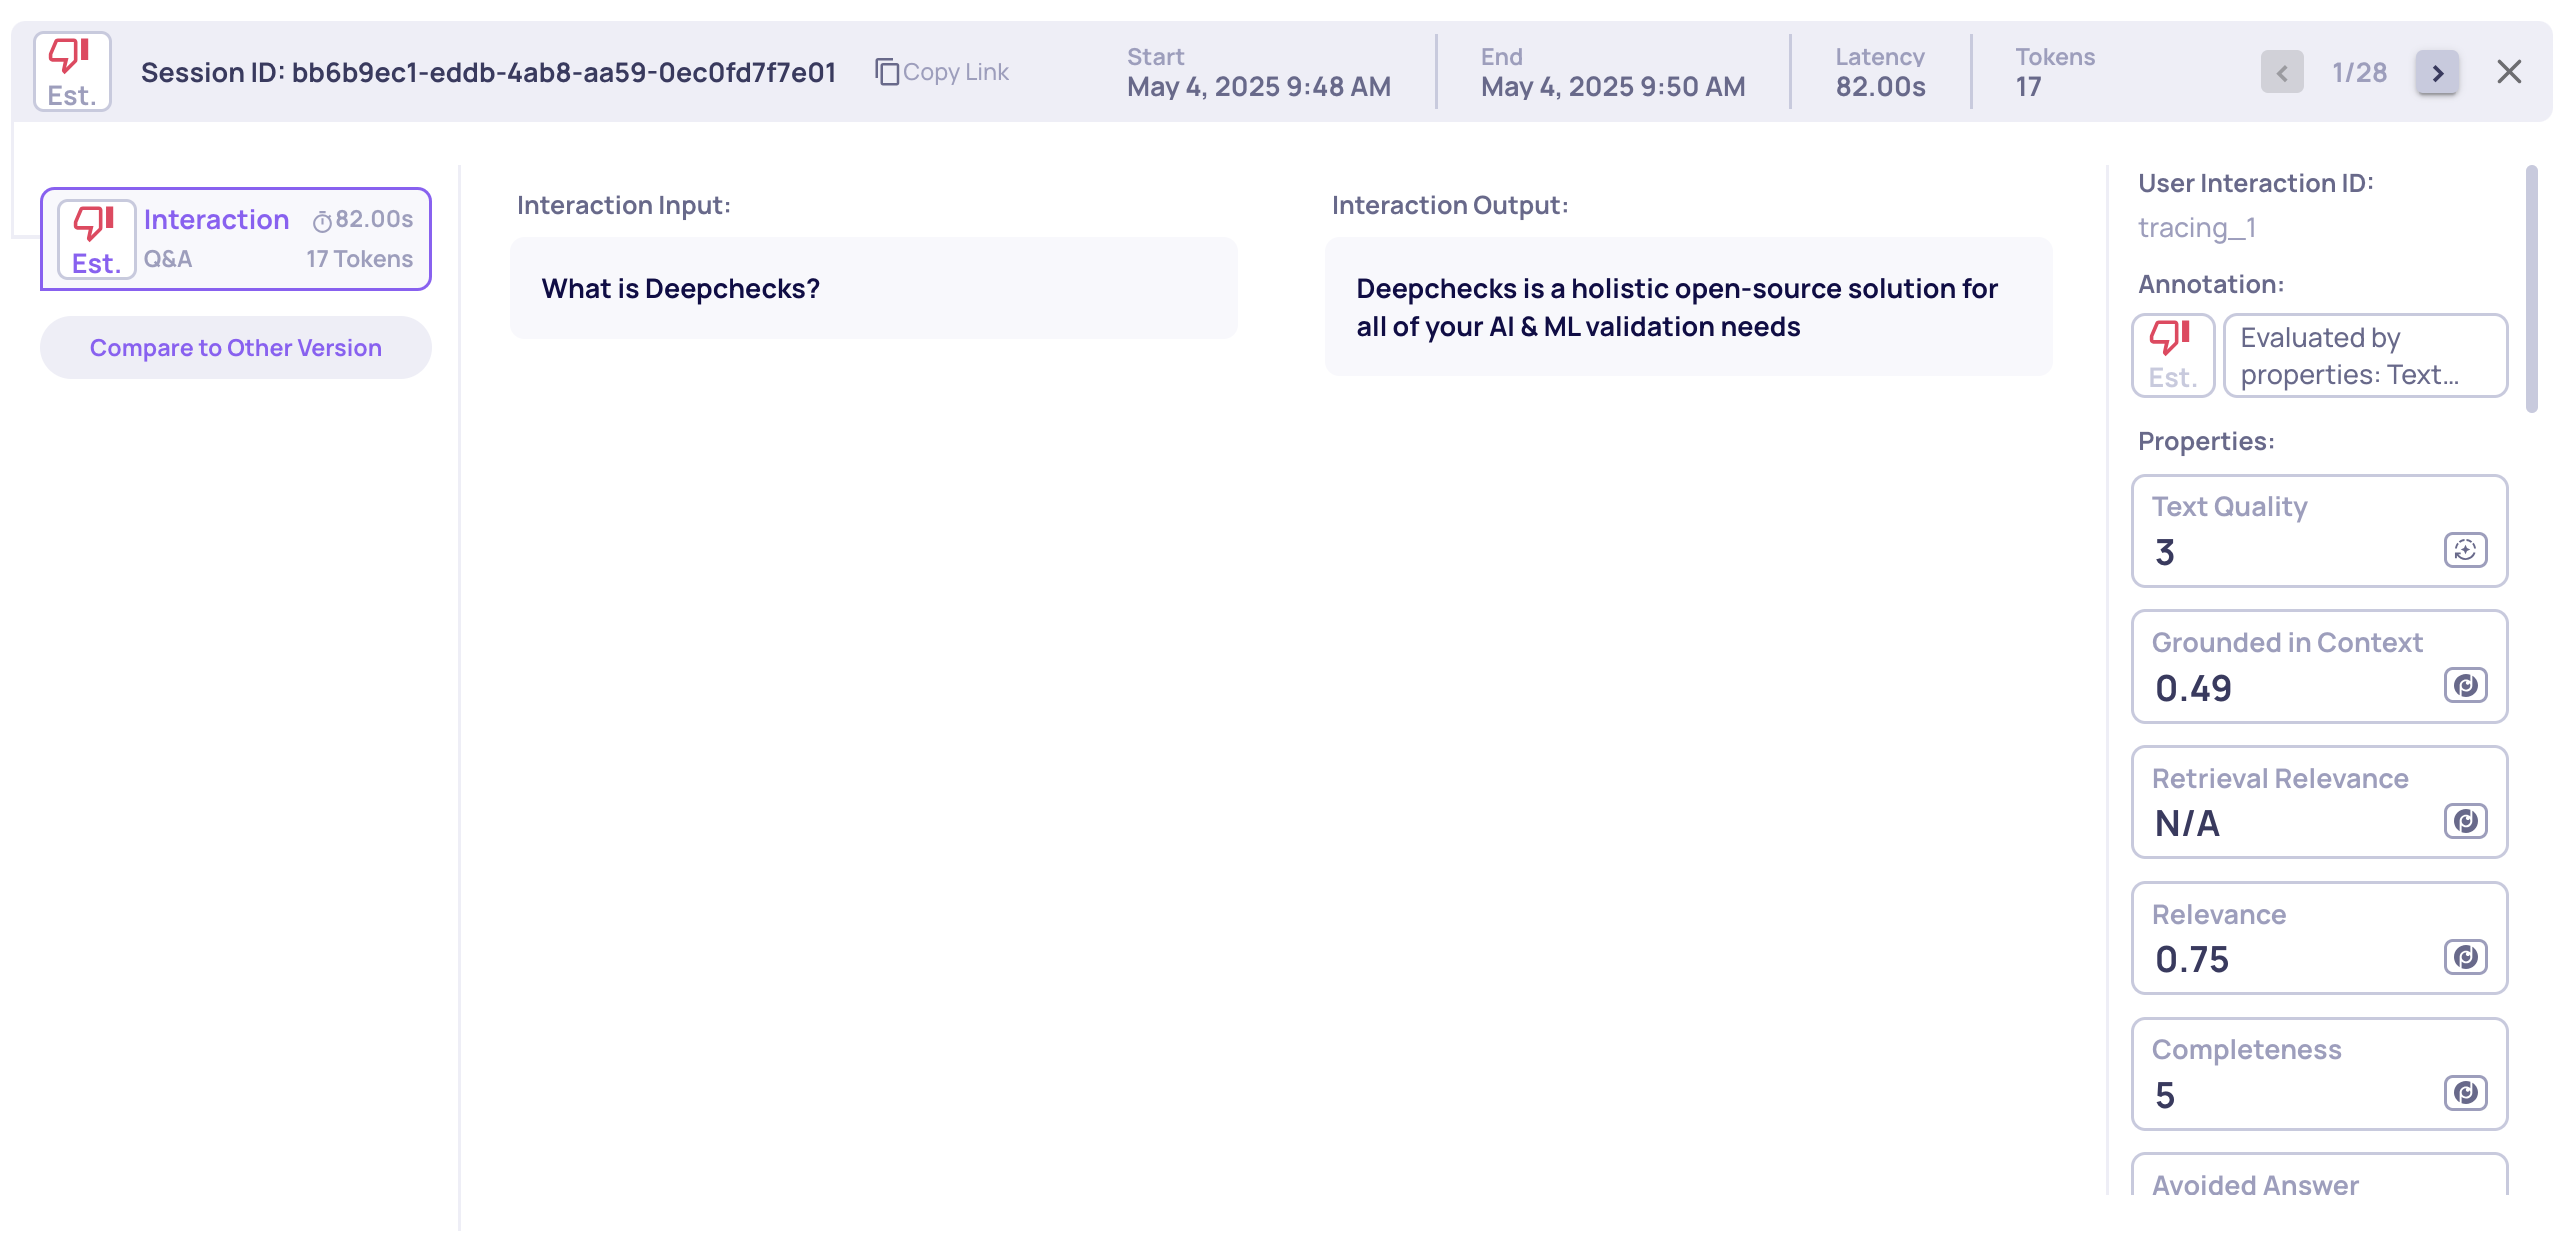
Single session latency and token usage
Session-Level Aggregation
system metrics are also aggregated from the interaction level to the session level:
- Session Latency: Total latency across all interactions in the session.
- Session Token Usage: Combined total token count, provided or parsed by Deepchecks, across all interactions in the session.
Missing System MetricsNote: If any interaction is missing latency data, session-level latency will not be calculated and displayed.
How You Can Use System Metrics
Once uploaded, these fields are accessible throughout the Deepchecks platform:
- Single Session View: system metrics are displayed alongside other properties for full visibility.
- Interactions screen: Use system metrics fields to filter, search, or sort the data within a certain version of your pipeline.
- Experiment Configuration: system metics data can be used as part of your experiment metadata, allowing you to compare versions not just by quality properties but also by runtime behavior (e.g., latency or token cost).
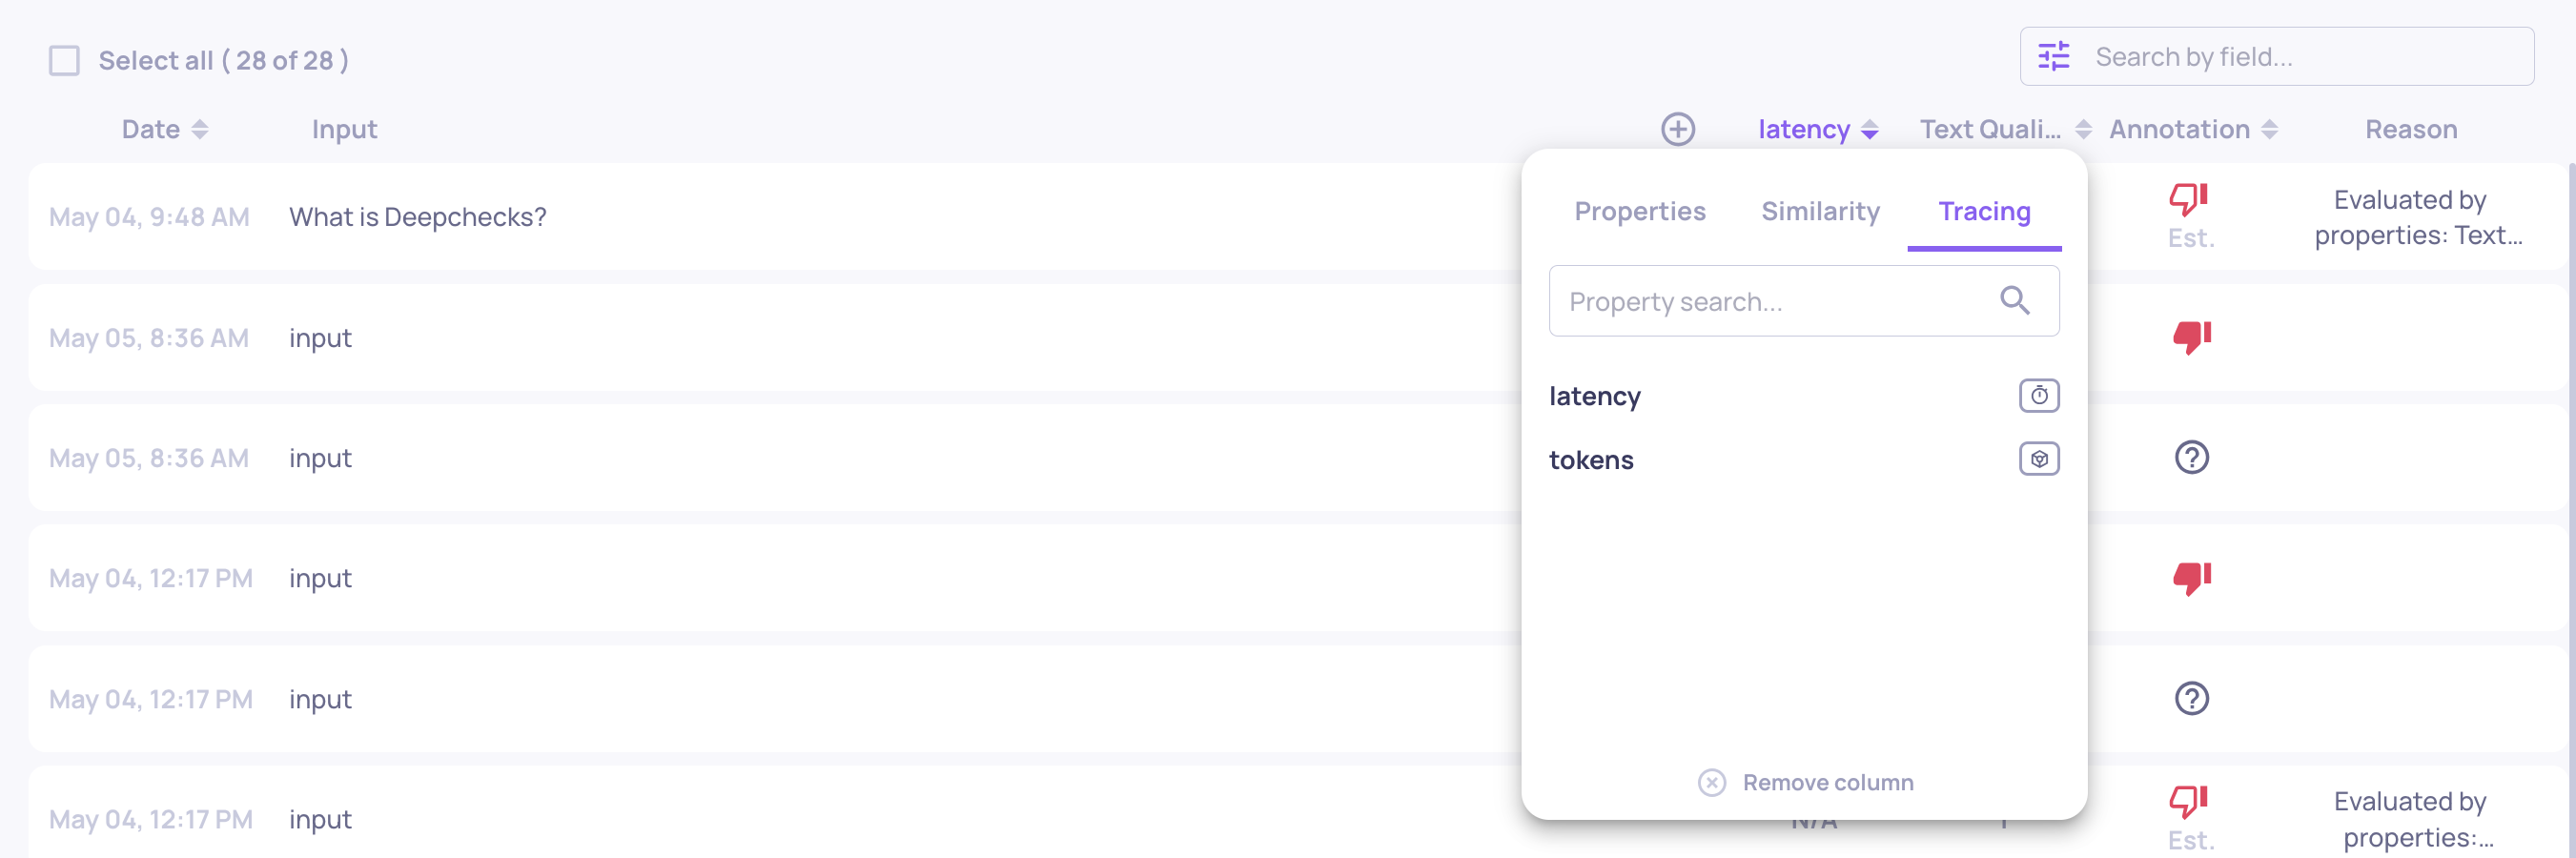
Sorting and Filtering by system metrics on the Interactions Screen
By leveraging systems metrics within Deepchecks, teams gain visibility into both quality and efficiency — improving observability, experiment analysis, and production reliability.
Uploading System Metrics via Tracing integrationNote: If you are logging data to the Deepchecks platform using a tracing integration, most system metrics will be logged to your version automatically.
Updated 2 months ago