Identifying Failures
The first step in debugging your application is identifying where it fails-a challenging task for text generation applications, given their many possible failure modes. In multi-step workflows, such as those involving agents or chatbots, your application may execute several different types of tasks within a single session (e.g., both Tool Use & Generation for agents). It’s important to first pinpoint the specific tasks that fail most frequently, and only then drill down to understand why those failures occur.
Ideally, you’ve reached this step after configuring a set of properties to evaluate the performance of each task your application performs. If you haven’t done this yet, we suggest starting with this guide.
Breaking Down Session Annotations
Start by visiting the Deepchecks Overview page and finding the Sessions and Interactions panel. This panel summarizes both the application’s overall (end-to-end) performance (Session), and the performance per task (Interaction Type). Performance is displayed as the percentage of sessions or interactions that have been given a positive annotation (a green thumbs up 👍🏽).
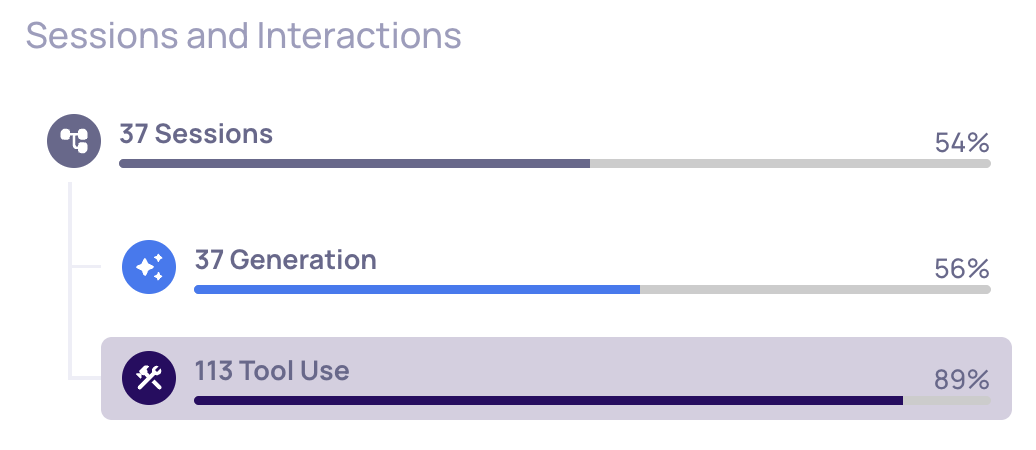
A version with 37 sessions, comprised of Generation and Tool Use interactions
A session’s annotation is determined by aggregating the annotations from its component interaction types. On the Interaction Types page, each interaction type with the "Is used for the session annotation" box checked must pass in order for the overall session to be marked as positive. Therefore, to analyze why sessions are failing, identify which interaction types are included in the session annotation, and then focus your investigation on failures within those specific types.
In the example above, the application handles both agentic Tool Use and Generation tasks-both of which contribute to the session annotation. While Generation tasks fail more frequently in this case, Tool Use tasks are performed more often. For the sake of this walkthrough, let’s focus on the Tool Use interaction type.
Next, let's explore which properties are most often responsible for failures within Tool Use tasks.
Breaking Down Interaction Type Annotations
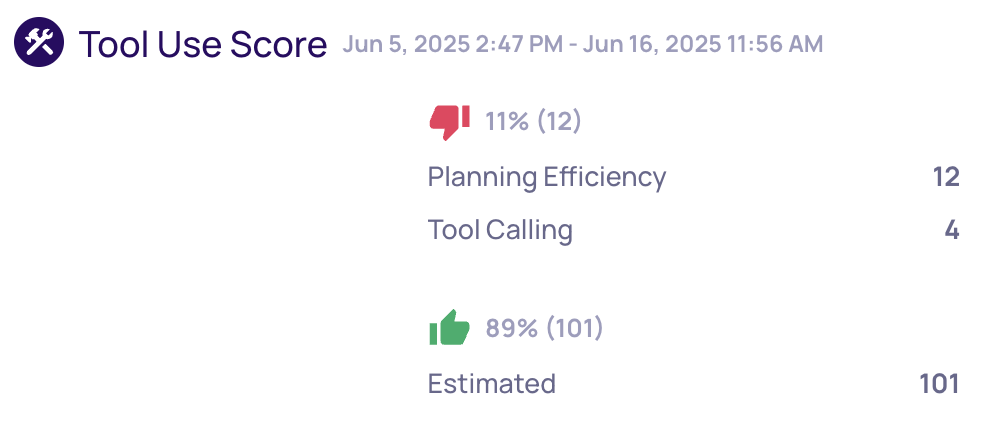
Score Breakdown of Tool Use interactions
Select a task type (such as Tool Use), and click Show Score Breakdown to view the number of passed/failed interactions per property. This helps you identify which evaluation properties contribute most frequently to task failures. In our example, Planning Efficiency is the property most commonly linked to failure-making it a logical starting point for more detailed investigation.
Updated 3 months ago