Navigate the single session view
A guide to navigating the Single Session View, designed to make sense of complex AI pipeline runs at a glance.
Introduction
AI pipelines can quickly become overwhelming: they involve not just raw inputs and outputs, but also layers of metadata, logs, and more. Once you start adding tests, properties, and nested spans, the amount of information can feel hard to untangle. That’s exactly why we built the Single Session View - to bring everything together in one place and help you see the full story of a run without losing track of what matters. This page walks you through how to read and use the view, with a clear screenshot and explanations, so you can navigate complex sessions with confidence and ease.
The Four Main Sections of the Single Session View
To make sense of a session, we’ve broken the screen into four main sections, each with its own role in helping you understand what’s going on.
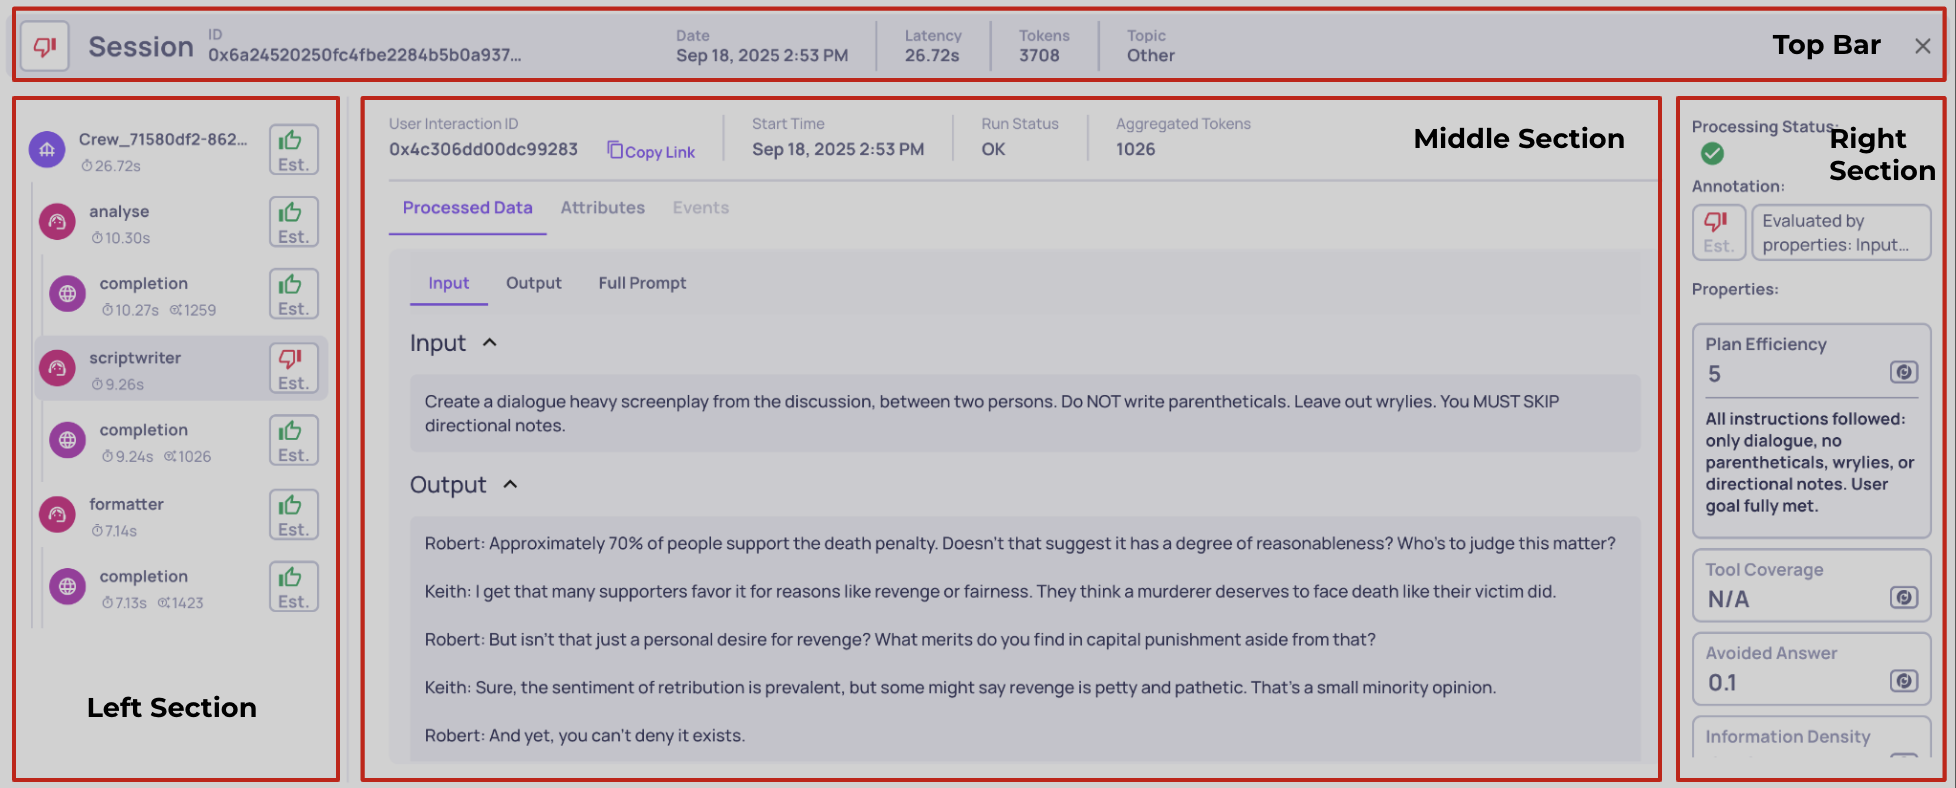
Dividing the single session view to four sections
Left section - This is your map of the session. It shows all the spans that together form the full trace. From here, you can quickly grasp the structure of the run and jump between different interactions. Think of it as your trace's table of contents.
Middle section - Once you select an interaction on the left, the middle section opens up all the raw details for that specific piece. This includes the data that was logged directly into Deepchecks, such as system metrics and any data fields. It’s the most direct window into what actually happened at that step.
Right section - On the right, you’ll find everything that Deepchecks adds on top of your raw data. This includes evaluation properties, annotations, and Deepchecks processing status for the chosen interaction. In other words, this is where you see how Deepchecks analyzes the raw execution.
Top bar - Finally, the top bar belongs to the session as a whole. It’s where you’ll find the session or trace ID, along with aggregated metrics that summarize the entire run across all interactions. This gives you a high-level snapshot without drilling into individual spans.
Single Session View - Components Explained
The below screenshot is annotated with numbered callouts. each number corresponds to a component explained here so you can read the image quickly and understand what each element does.
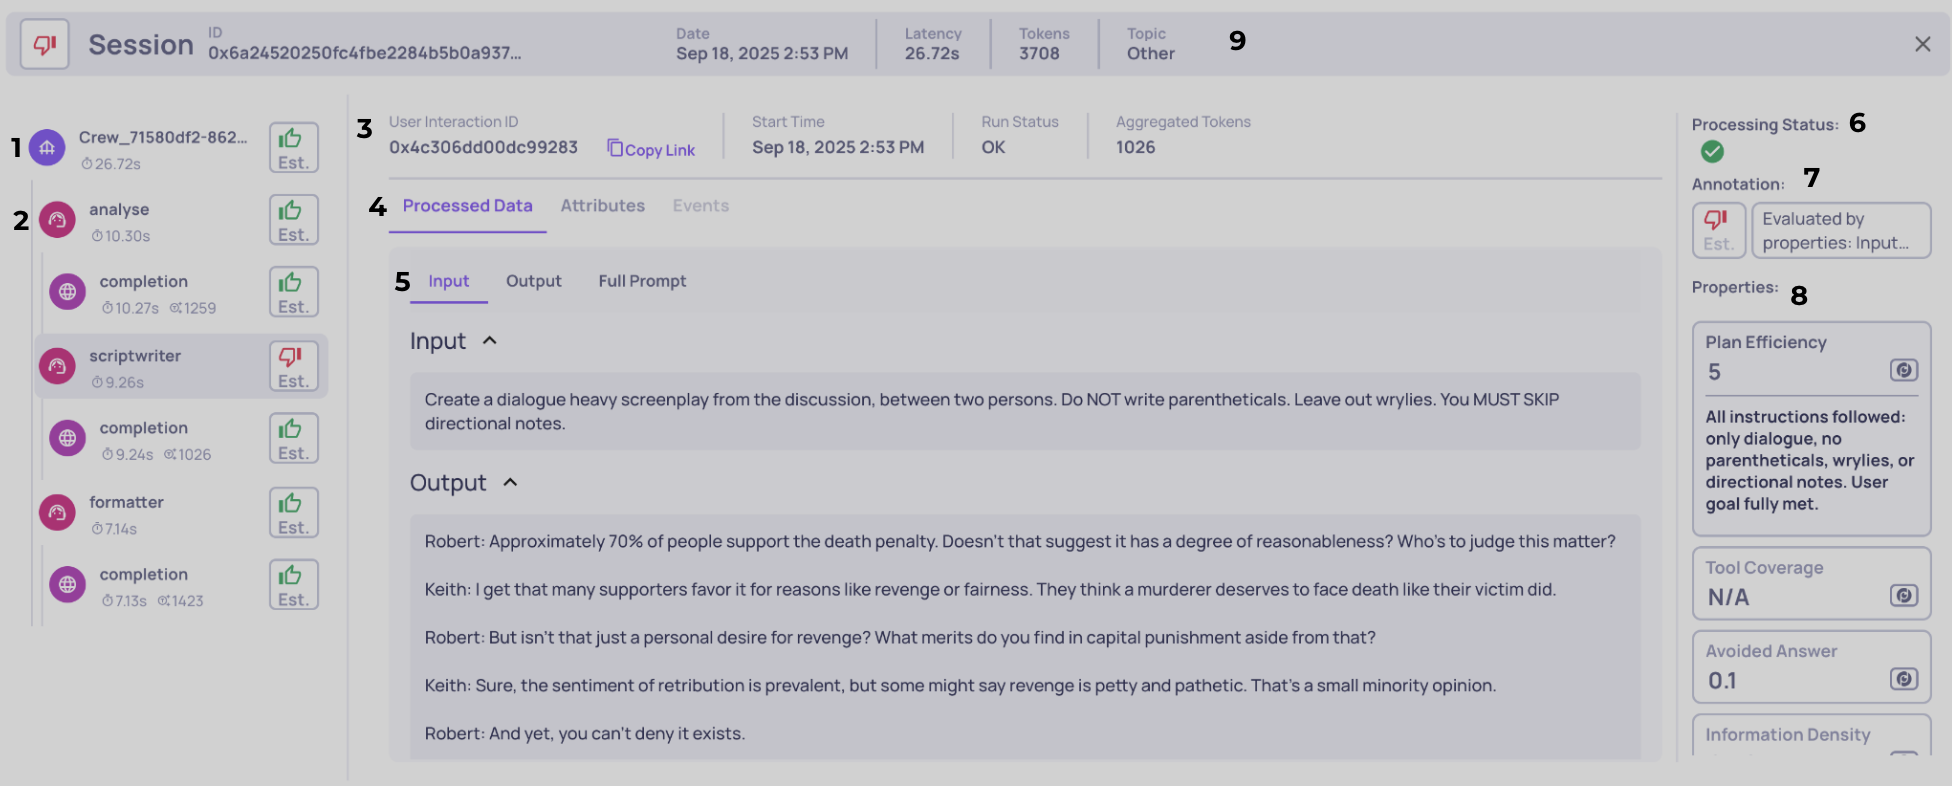
1 - Single interaction tab
Selecting a tab makes the middle and right sections show all data for that specific span/interaction. The tab itself gives a compact, at-a-glance summary for that span: an icon that indicates the interaction type (Root / Agent / LLM / Tool), measured latency, token usage if relevant, and the span’s calculated annotation (detailed below). Hovering over the interaction type opens a tooltip with extra metadata and a short explanatory note (for example, timestamps, span id, or a short description), so you can get context without leaving the list. **Tip:**use this tab as your main navigation control - clicking different tabs swaps the selected interaction and updates the rest of the screen immediately.
2 - Span hierarchy & visual nesting
The left column shows parent↔child relationships visually - indentation plus vertical connector lines make the trace structure obvious (in the screenshot the "analysis" Agent span is a child of Root and a parent of an LLM span). These hierarchies are more than cosmetic: they’re how we represent the execution tree and they matter for three core reasons:
- Observability & navigation: the tree helps you quickly find where a given action happened in the run and to traverse complex multi-step flows.
- Metric aggregation: rollups (e.g., total latency, aggregate token usage) are computed from the hierarchy, so you can see both per-span metrics and their contribution to higher-level nodes.
- Evaluation logic: many built-in properties use parent/child relationships when computing scores (for example, agent-level properties that inspect their tool children). The UI hierarchies make it clear which spans will be included when a property uses child or descendant data.
3 - Span system metrics & metadata
When you select a span on the left, the middle section updates with its raw system data. This tab is your hub for all low-level metrics and metadata logged with the span, such as Span ID, start/end timestamps, run status (OK, ERROR, UNSET, etc.), aggregated token counts (for parent spans, aggregated tokens include actual tokens of all descendants).
From here, you can also copy a direct link to this interaction’s view, making it easy to reference the exact span in another screen, in your workflow, or when sharing context with teammates. Think of this as the "system factsheet" for each span.
4 - Data source selector
Not all information in a span comes from the same place, so this control lets you toggle between three distinct data sources:
- Processed Data (default): Parsed and structured fields that Deepchecks uses for evaluation. This may be data you uploaded (input, output, prompt, retrieval chunks, etc.) or data logged automatically through integration and mapped by Deepchecks into schema.
- Attributes: Any additional span attributes you logged, displayed in raw JSON format.
- Events: Logged events tied to the span, also shown as raw JSON.
This separation makes it easy to move from a clean, structured view (processed data) to the full raw logs when you need deeper debugging context.
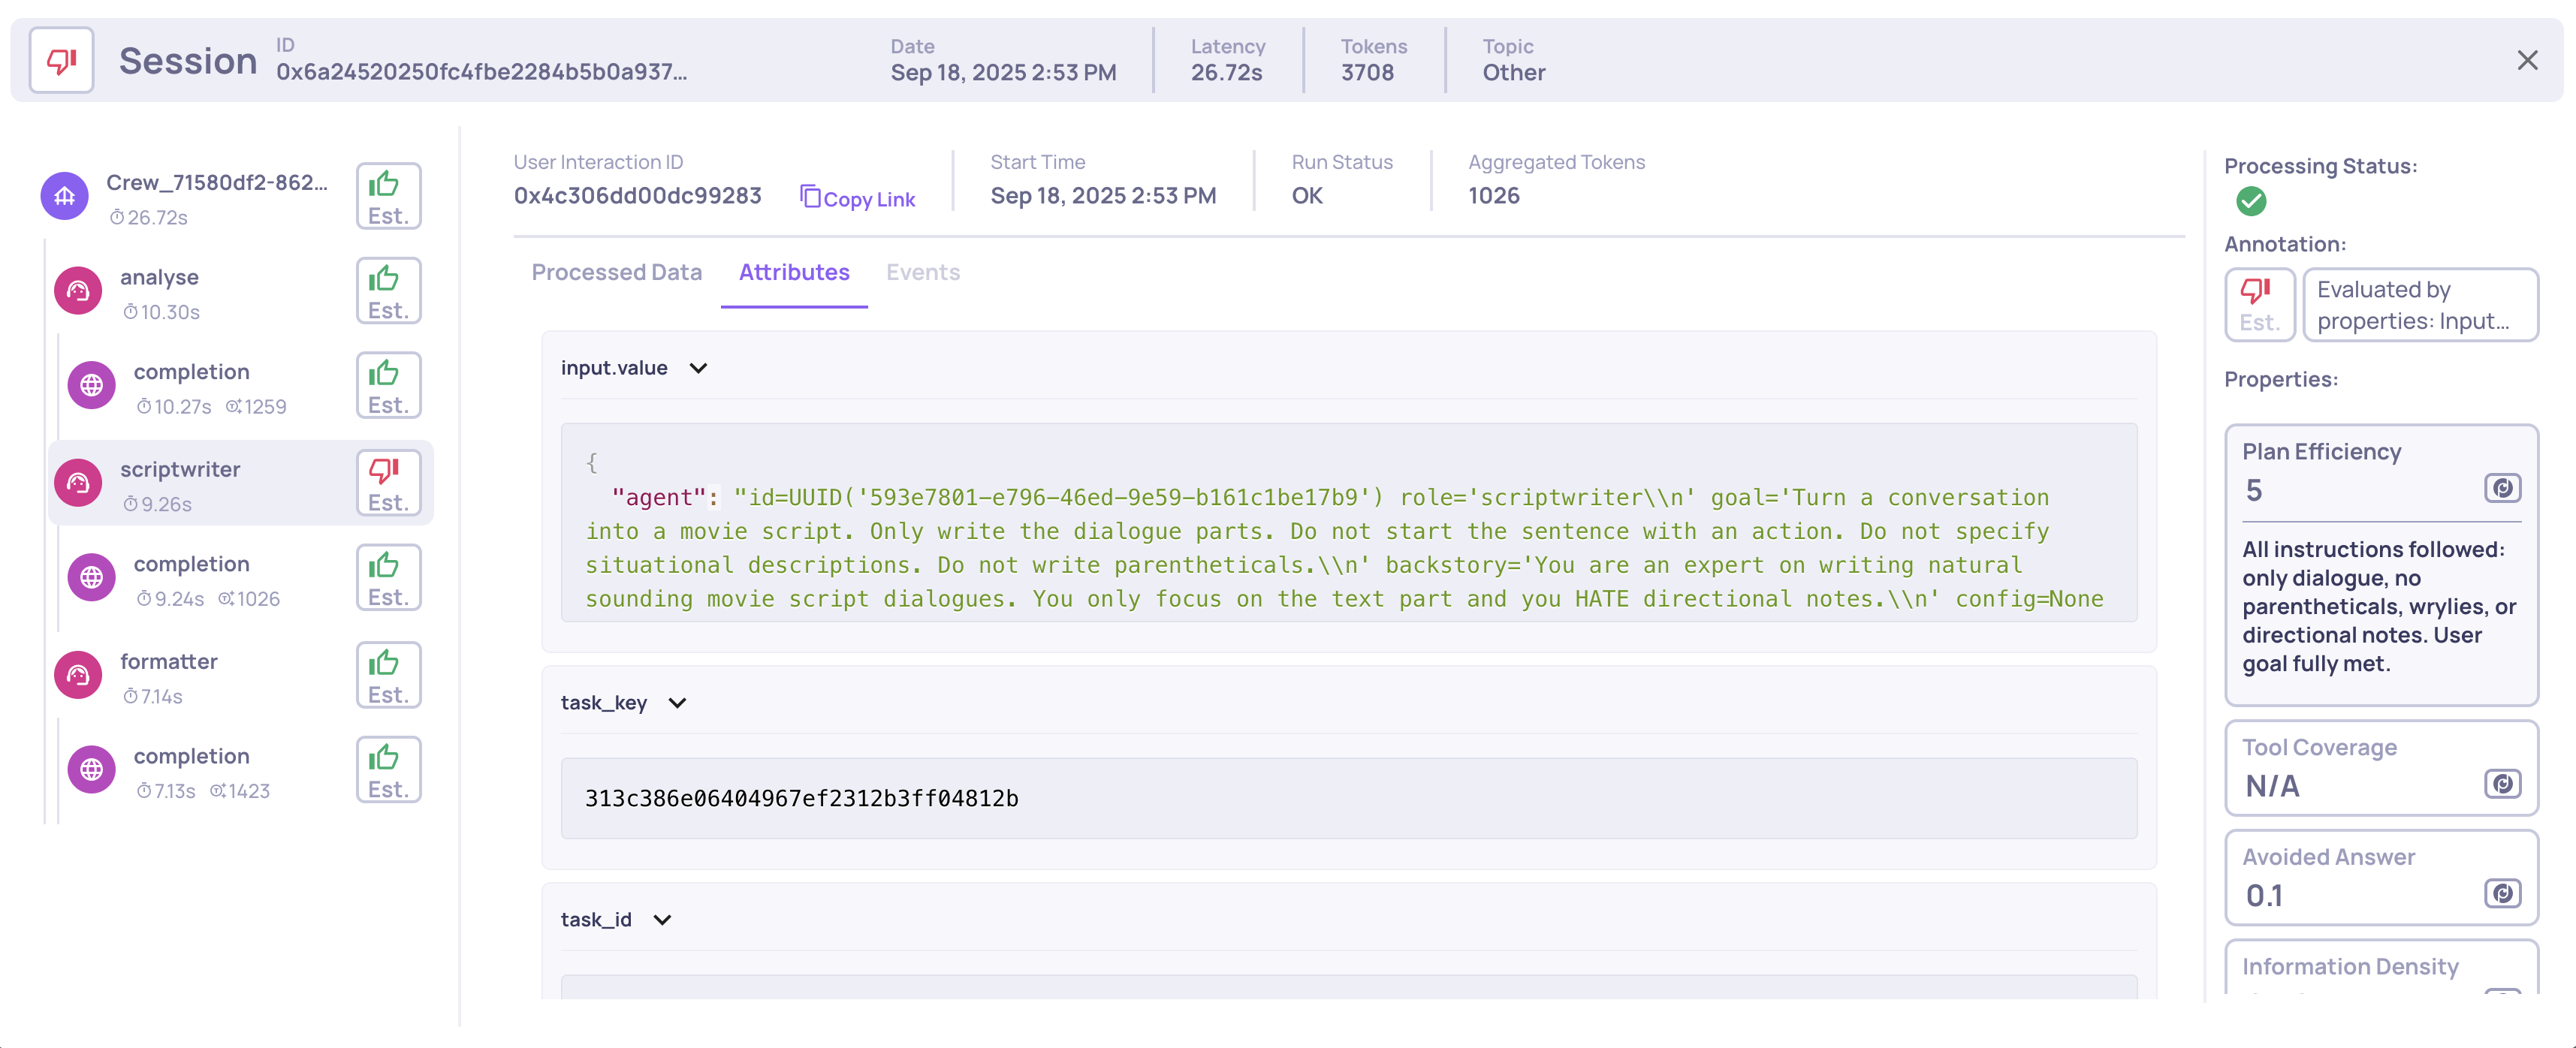
Viewing the span's logged attributes
5 - Processed data field navigation
Processed data itself is broken down into multiple data fields (for example: Input, Output, Full Prompt, Retrieval Context). This bar helps you navigate between them and decide which fields to expand or collapse. Each field can be opened for detailed inspection or collapsed for a cleaner view, so you can focus on what’s relevant for your current analysis.
Importantly, these are the same data fields that Deepchecks uses as inputs when calculating evaluation properties - so what you see here is directly tied to the scoring and annotations shown in the right-hand panel.
6 - Deepchecks processing status
This panel shows the current status of Deepchecks’ processing for the selected interaction. There are three possible statuses, each marked with a distinct icon:
- Done: All calculations for this interaction are complete and final - scores, annotations, and metrics will not change.
- In Progress: Some evaluations or property calculations are still being processed. You can review the interaction, but note that certain values may update once processing finishes.
- Failed: A problem occurred during calculation. Any incomplete or failed evaluations will remain unavailable until you intervene (for example, by re-uploading the interaction).
This status gives immediate visibility into whether your interaction data is fully ready for analysis or still evolving.
7 - Annotations
The annotations panel displays the human and estimated annotations associated with the interaction. By default, any human-provided annotation will be shown first. If none exists, or if you click on the annotation panel, you can also view the estimated annotation produced by Deepchecks’ automated pipeline.
Both annotation types include reasoning explanations: human annotations show the user’s notes, while estimated annotations include the system’s reasoning for its assessment. This panel also allows users to add or edit human annotations directly, providing extra flexibility for your annotators.
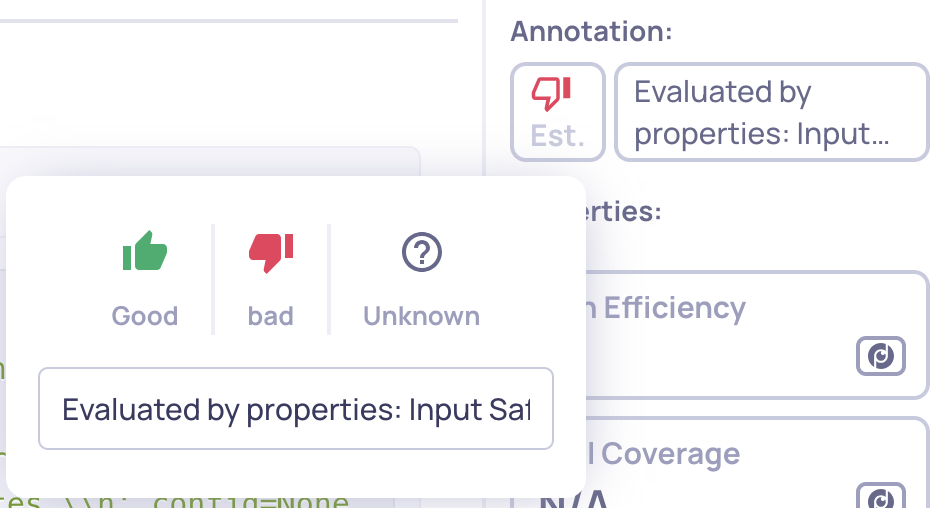
A click on the displayed annotation enables to configure the human annotation
8 - Property list
Here, you can view all properties relevant to the selected interaction. The displayed properties are determined by:
- The interaction type
- The properties you activated for that interaction type in the Properties screen
Properties are organized into two groups: Pinned properties (those starred to your Overview dashboard) appear first, followed by all Other properties. Within each group, properties that have a calculated value are shown first, while properties with no value (N/A) are pushed to the end. Each property entry shows:
- The property name (hovering reveals a description)
- The type (built-in, prompt, or user-value)
- The score assigned to the interaction
Clicking on a property expands it to show the full reasoning behind its score, allowing you to drill down into why an interaction received a particular evaluation. Note that in many cases null scores have reasoning too, explaining why a null score was calculated.
Example of a null score reasoning
9 - Session bar
The top bar provides a session-level overview, summarizing the entire set of interactions in a session or trace. It includes:
- Session ID: Usually the logged trace ID. If multiple traces belong to a session, it will display the session/group name.
- Start timestamp: Typically the timestamp of the first span in the session.
- Aggregated latency and tokens: Summarizes performance metrics across all interactions.
- Session topic: Provides context for the session’s overall purpose or goal.
This bar allows you to stay oriented at the session level, independent of which individual interaction is selected, giving a quick snapshot of the full trace.