Agent Execution Flow Graph
Agent Execution Flow Graph
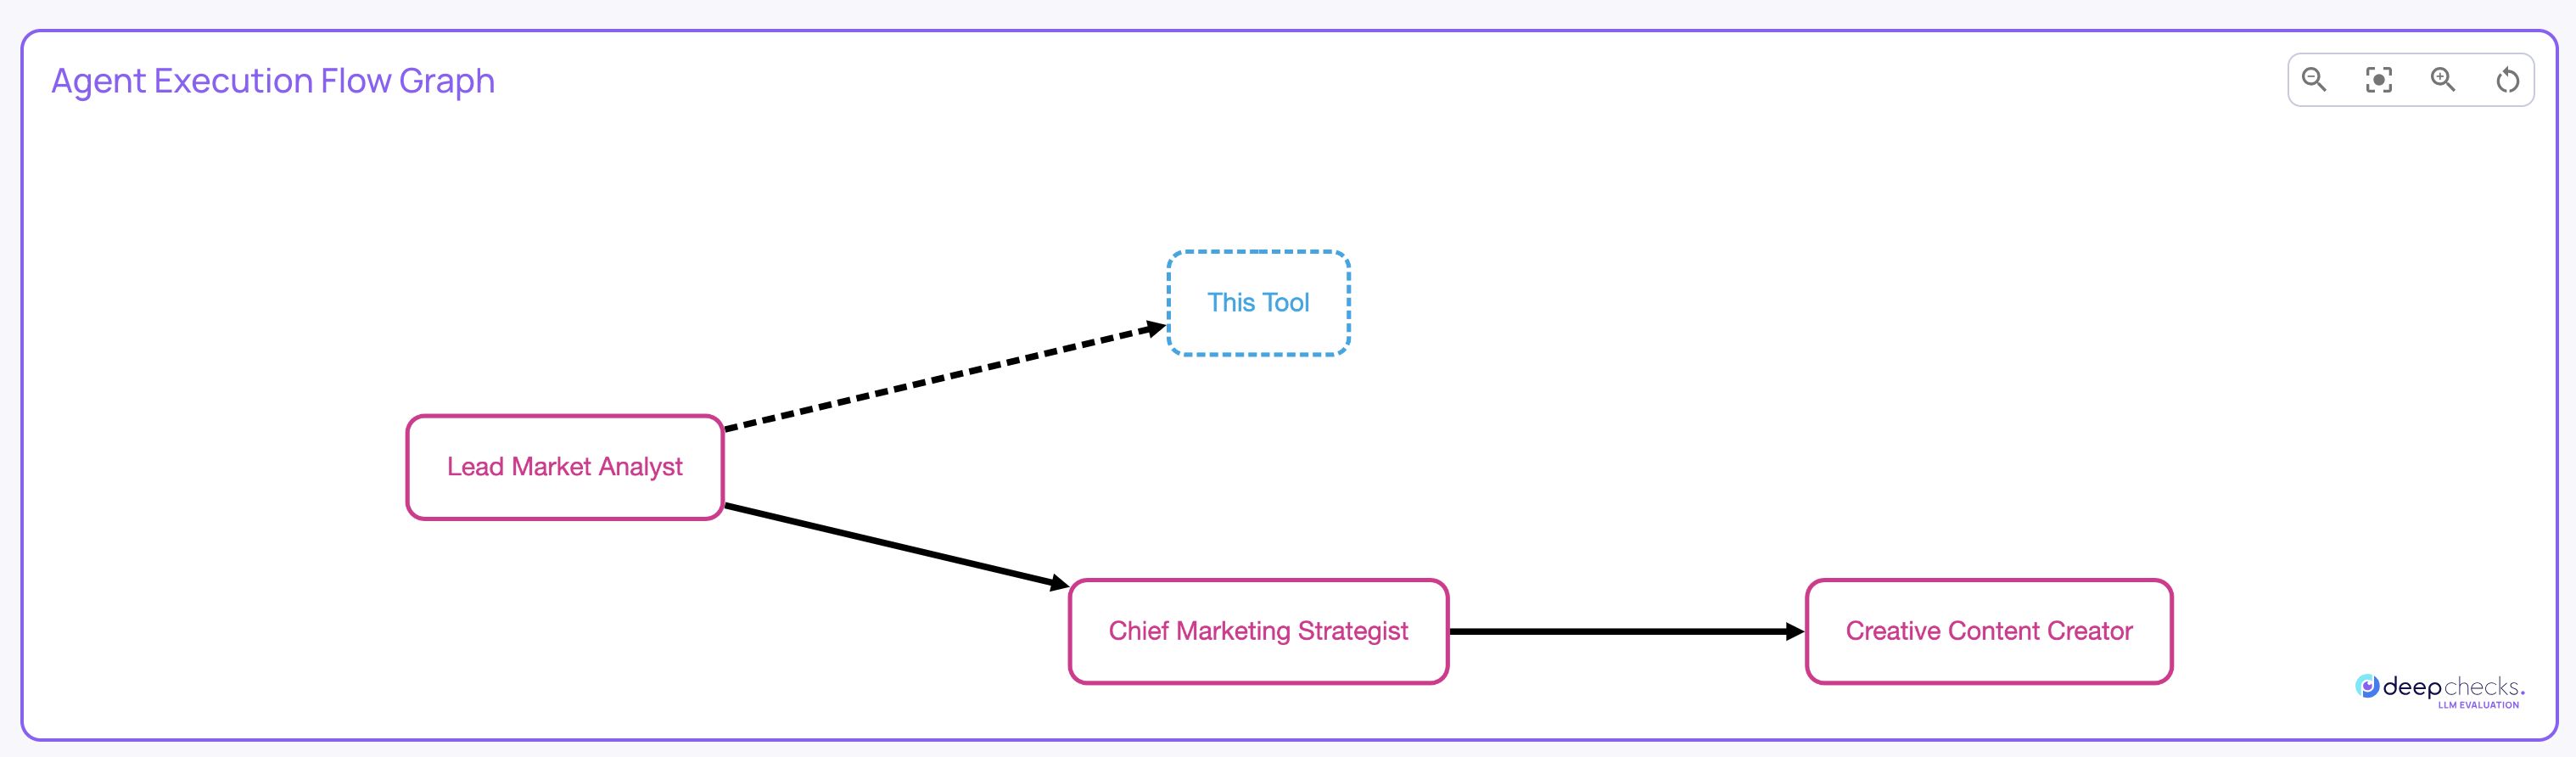
The Agent Execution Flow Graph provides a directional, visual map of how your agentic pipeline actually runs across all filtered traces. Instead of relying on your intended design, the graph reflects the real execution paths observed in production - branches, loops, optional steps, repeated calls, and transitions.
Deepchecks builds this graph automatically using the attributes available in your spans. Different frameworks (e.g., LangGraph, CrewAI, custom orchestrators) emit different structures and metadata, but Deepchecks interprets these attributes and translates them into a unified execution graph. No instrumentation changes or custom formatting are required.
This gives you a reliable, high-level view of your system’s behavior, directly grounded in real runtime data.
Nodes
Each node in the graph represents a span name - essentially a step in your agentic workflow.
Node Appearance
- Solid border → the node appeared in every trace (a required or invariant step)
- Dashed border → the node appeared only in some traces (a conditional or branching step)
Node Coloring
Each node is color-coded according to its interaction type. Because interaction types represent logical categories of behavior (Agent, Tool, Generator, Q&A, etc.), the node colors make it easy to visually track how your agent transitions between different modes of execution.
This helps you understand patterns like:
- When tool calls are triggered
- Where sub-agents or different reasoning modes activate
- How often the workflow returns to generation steps
- Whether specific behaviors are isolated or repeated across the pipeline
Node Metadata (Hover)
Hovering over a node reveals aggregated insights, such as:
- Total number of occurrences across all filtered traces
- Average occurrences per trace
- Additional span-level metadata
Node Click
Clicking a node jumps directly to the Interactions screen, pre-filtered to show only the instances of that specific span across your filtered runs - making it easy to validate behavior or inspect anomalies.
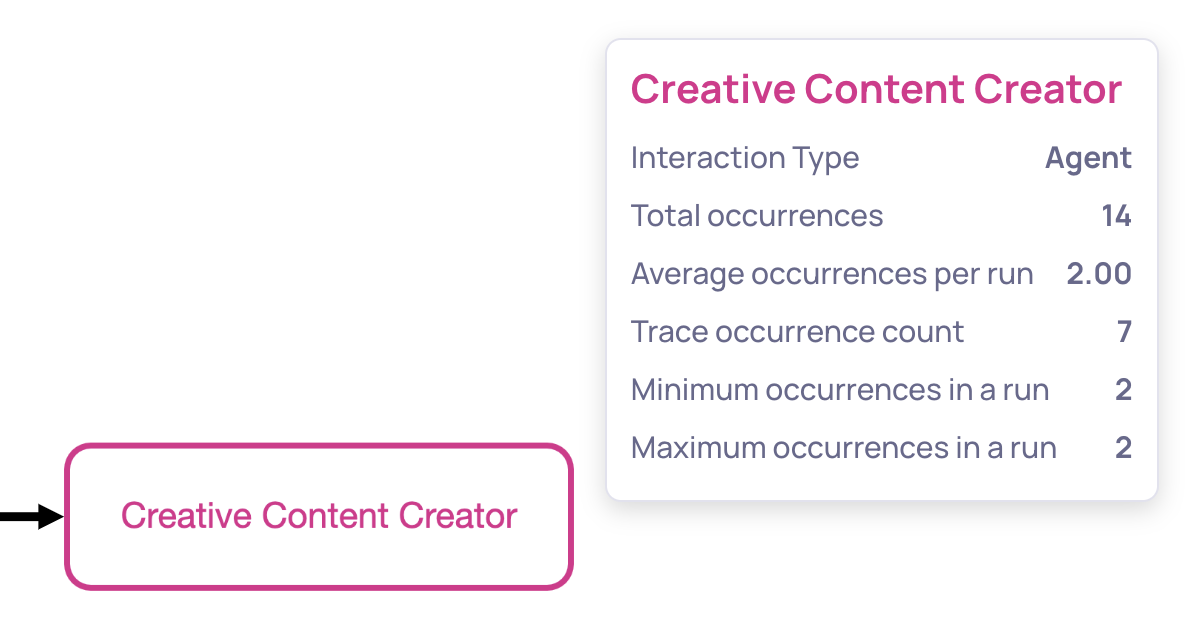
Node hover functionality
Edges
Edges represent the observed transitions from one span to another.
Edge Appearance
- Solid line → the transition appeared in every trace
- Dashed line → the transition appeared only in some traces
Edge Metadata (Hover)
Hovering an edge displays:
- How many times the transition occurred across all traces
- How often it appeared per trace on average
This helps identify optional transitions, loops, or unexpectedly frequent paths.
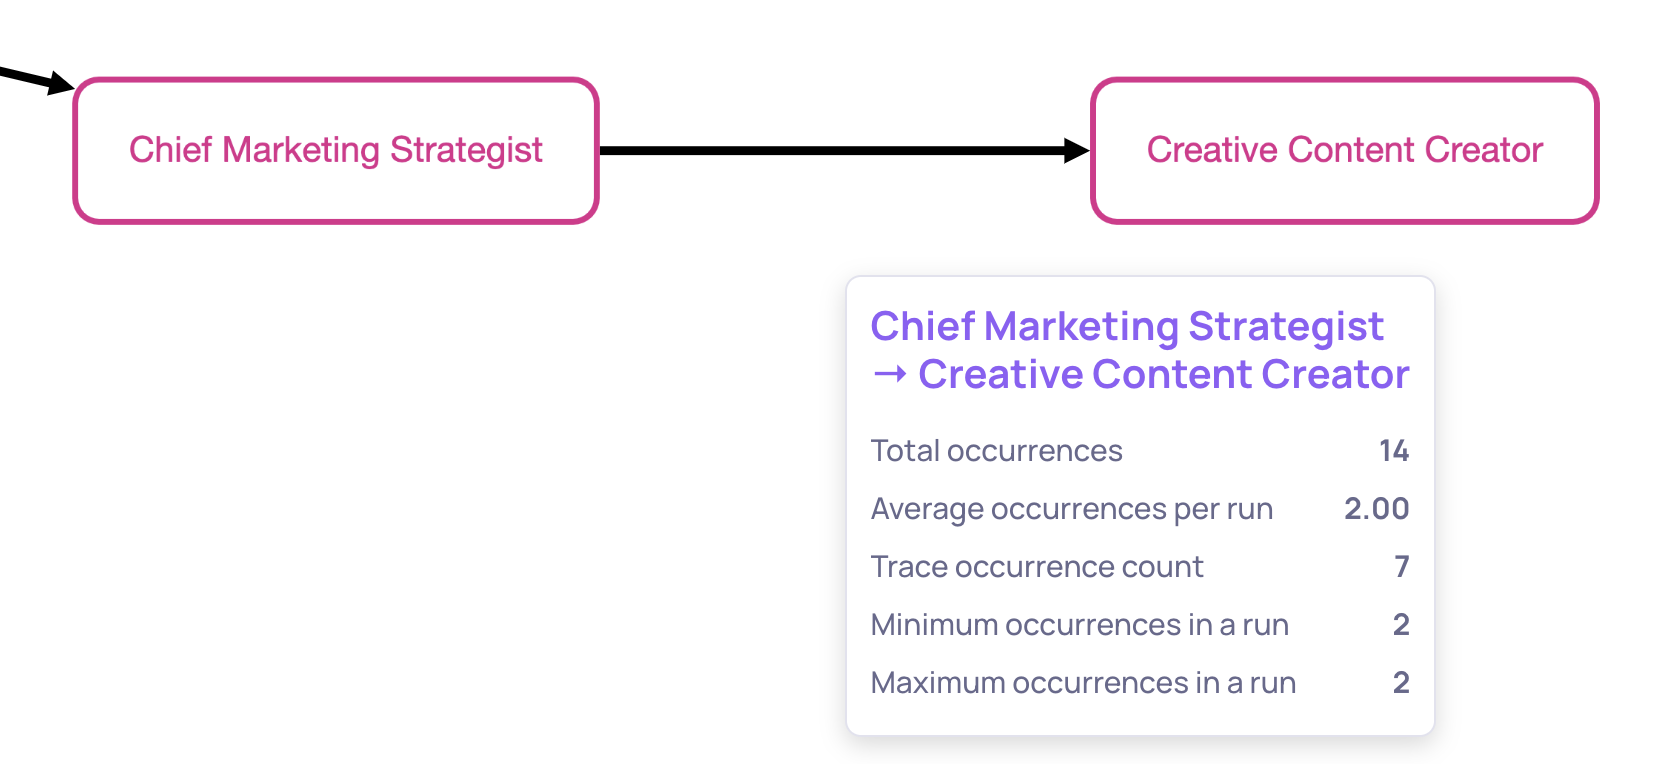
Edge hover functionality
Navigating and Exploring the Graph
The graph supports interactive exploration:
- Hover nodes or edges to reveal metadata
- Click nodes to view their actual interactions
- Zoom in / Zoom out for readability
- Auto-fit / optimize layout to neatly refit the graph
- Reset view to return to the default arrangement
This creates a smooth workflow for shifting between high-level pipeline understanding and low-level debugging.

Interactive exploration options
Where to Find It
You can access the Agent Execution Flow Graph in: Overview → Sessions, when viewing an agentic use case that contains sufficient span data.
The graph automatically reflects whichever filters you apply (version, interaction type, time window, etc.), allowing you to analyze execution patterns across any subset of your runs.
Updated 4 months ago