Deepchecks LLM Evaluation for Agents
Modern AI applications increasingly rely on agentic and multi-agent workflows - systems that reason, plan, delegate, call tools, and interact across multiple steps before producing an output. These workflows are powerful, but they also introduce complexity - where did the reasoning go wrong? Why did the agent pick this tool? Was the plan efficient? Which branch of the workflow created the failure?
To answer these questions, teams need complete observability across spans, traces, and sessions, and evaluation that understands the logic of agentic pipelines. Deepchecks provides a full suite of capabilities designed specifically for this.
Understanding Spans, Traces, and Sessions in Deepchecks
Agentic systems naturally form a hierarchy:
- Span → the atomic interaction (LLM call, tool call, plan step, retrieval step, etc.)
- Trace → a full execution composed of one or more spans
- Session → one or more traces grouped by a shared user or conversation
In Deepchecks:
- A span is represented as an Interaction and can be filtered, inspected, and compared in the Interactions screen.
- A trace is represented by the Root Interaction Type, which aggregates all descendant span data and de-facto exposes trace-level metrics.
- A session is visible on the Sessions screen, showing patterns across multi-turn experiences.
This structure ensures you can analyze your agentic system from the smallest LLM call all the way up to the full end-to-end workflow.
Uploading Agent Data to Deepchecks
Deepchecks supports ingesting agentic data in two ways:
Auto-Instrumentation with Popular Agent Frameworks
If you’re using frameworks like CrewAI, LangGraph, or Google ADK, you can enable full tracing and logging with only a few lines of code. Deepchecks automatically captures:
- Span hierarchy
- Span attributes
- Tool calls and their inputs/outputs
- LLM completions
- Agent-level steps
- More
Tracing is done via our instrumentation layer, and the structure is mapped directly into Deepchecks’ Interaction Types - no manual formatting needed.
Manual Logging (Full Control)
If you prefer to push logs manually, Deepchecks allows you to send spans and define the parent-child relationships yourself. This is useful mainly when you have a custom orchestrator or if you’re modifying or transforming the metadata before sending it. The key requirement is maintaining the span hierarchy so Deepchecks can reconstruct the trace and apply the correct built-in configurations.
Built-In Interaction Types for Agentic Workflows
To provide strong value out–of–the–box, Deepchecks automatically assigns every span to an Interaction Type:
- Root (always present)
- Agent
- Chain
- LLM
- Tool
- Retrieval
These interaction types determine which properties will be calculated for each span, what auto-annotation flow will be applied, and how the trace will be displayed. Because each type has its own logic, Deepchecks can provide accurate, research-backed evaluation even before any customization.
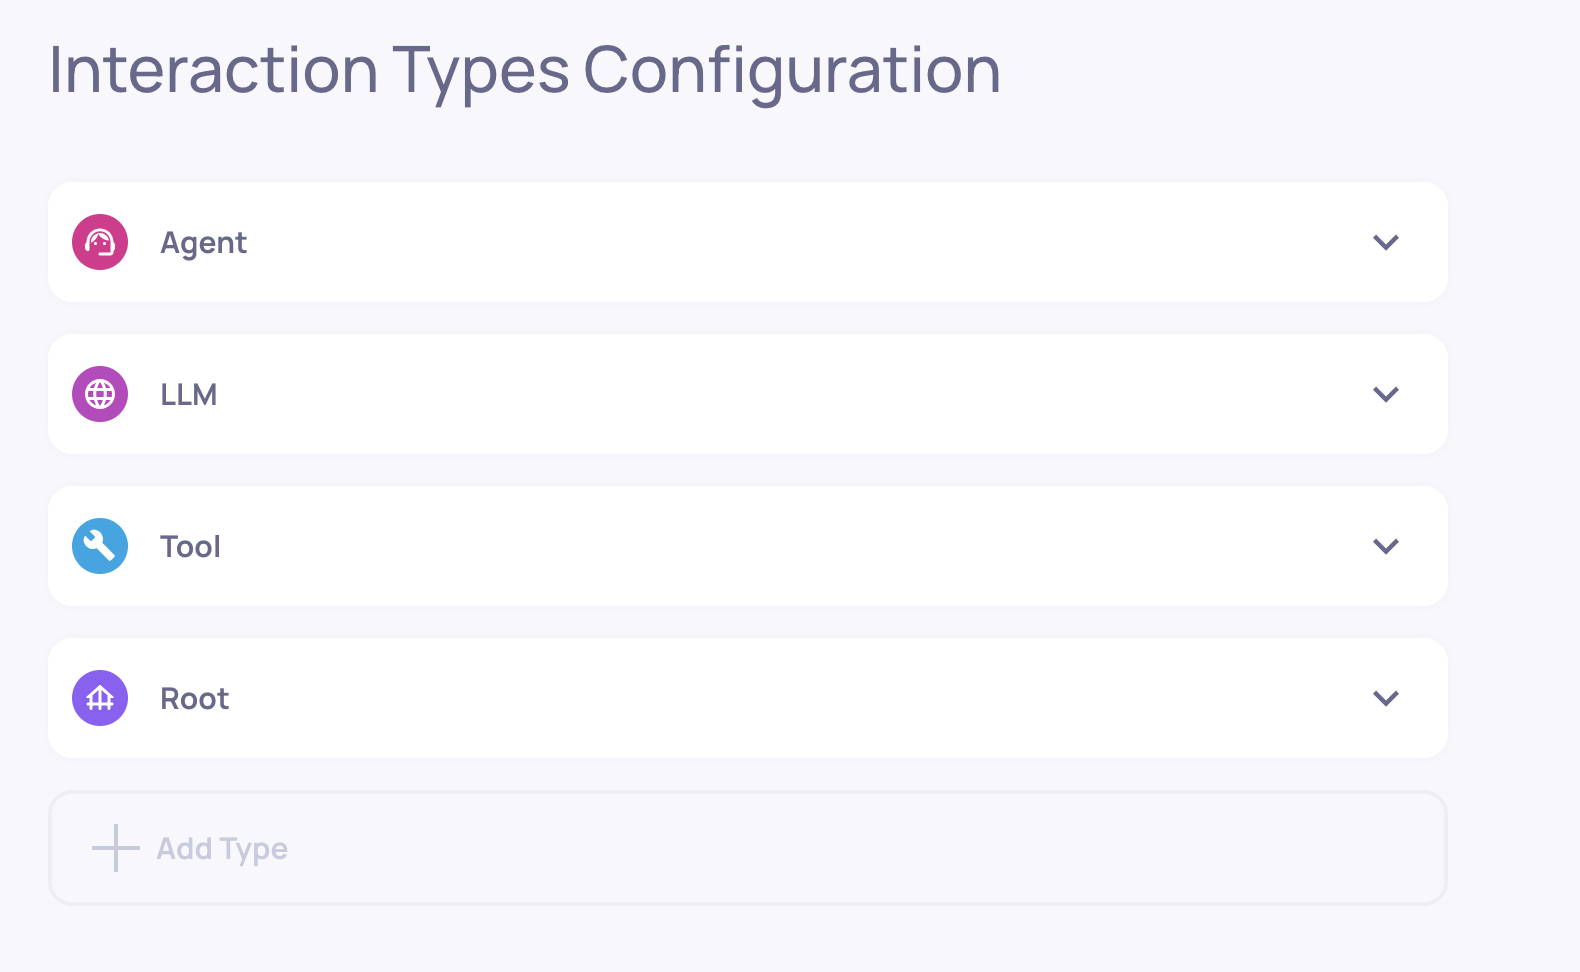
An agentic application with the Root, Agent, LLM and Tool interaction types
Built-In Agentic Properties
Agent properties help evaluate planning, tool use, action selection, and multi-step behavior. A few examples include:
- Plan Efficiency - how well the agent creates and executes a coherent plan
- Tool Coverage - whether the agent chose tools covering the goal
- Tool Completeness - whether each tool’s output fulfills its purpose
These properties complement Deepchecks’ general LLM evaluation metrics and help teams understand multi-step performance.
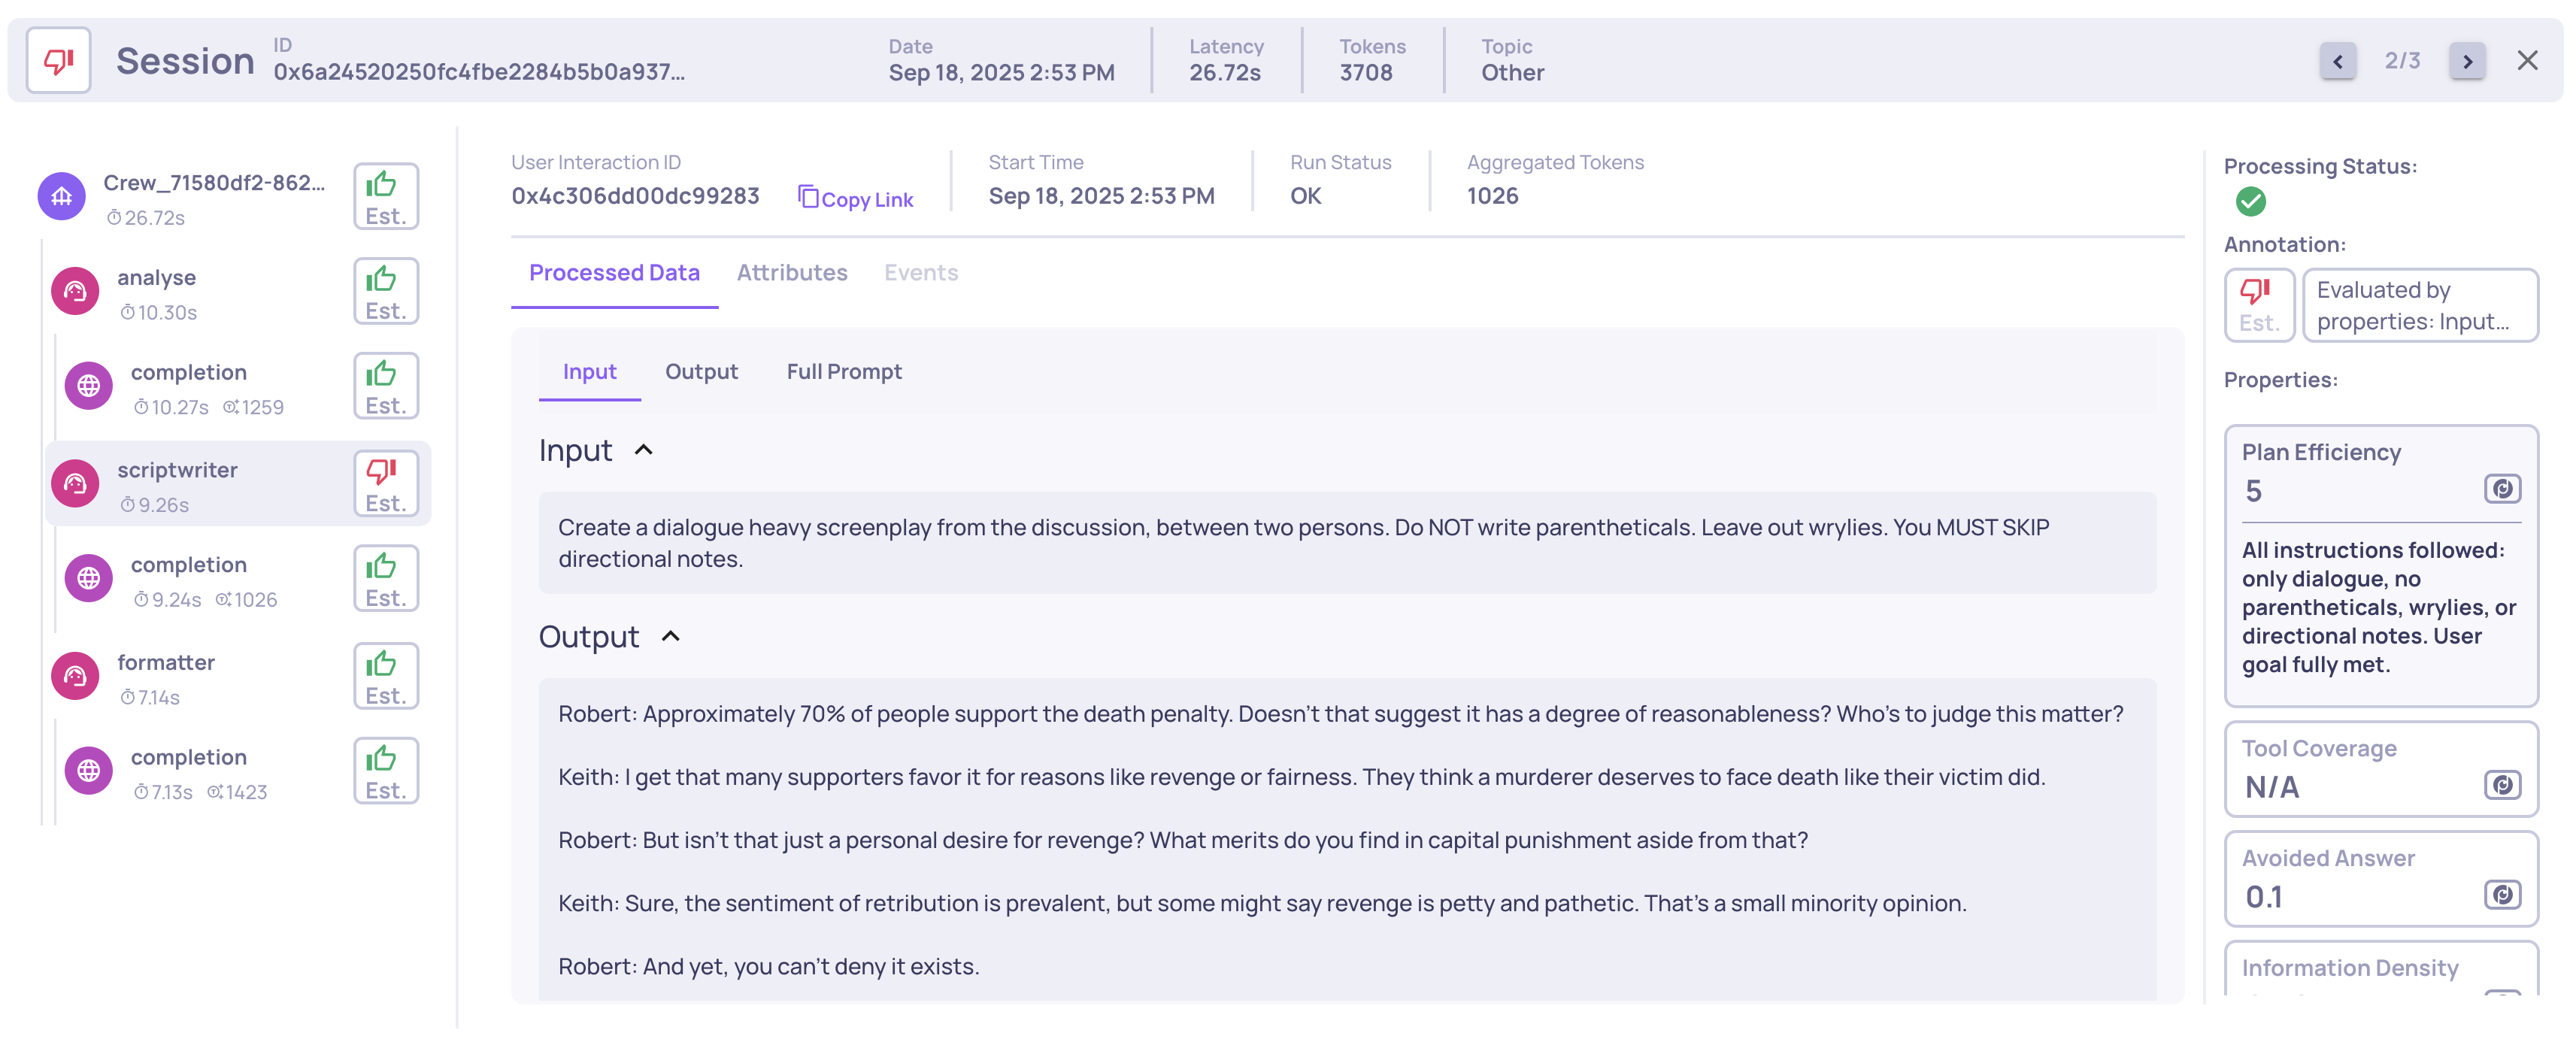
Example of a Planning Efficiency score and reasoning on an Agent span
See the full list of agentic properties here.
Advanced Controls for Agentic Use-Cases
Deepchecks includes advanced mechanisms to give you full flexibility when evaluating your agents.
Mapping Any Span to a Custom Interaction Type
Sometimes your system has custom steps that don’t quite fit the default categories. For example, you might want two agents, the “Planning” agent and the "Executing" agent to have different configurations (even though both are of Agent interaction type by default).
Deepchecks allows you to map spans to custom interaction types by span name, which immediately updates the configuration, enabling different properties, auto-annotation rules and displays to apply.
This ensures every span is evaluated and displayed using the right semantics for your workflow. Click here for the step-by-step guide.

Creating Custom Properties Using Descendant Data
Agent and Root spans may need access to the data of their child spans - tool inputs, LLM outputs, retriever documents, etc.
Deepchecks allows custom properties to freely access all descendant spans, enabling:
- Root-level (trace-level) metrics
- Agent-level quality scores
- Cross-span calculations
This unlocks highly specialized evaluation for complex pipelines.
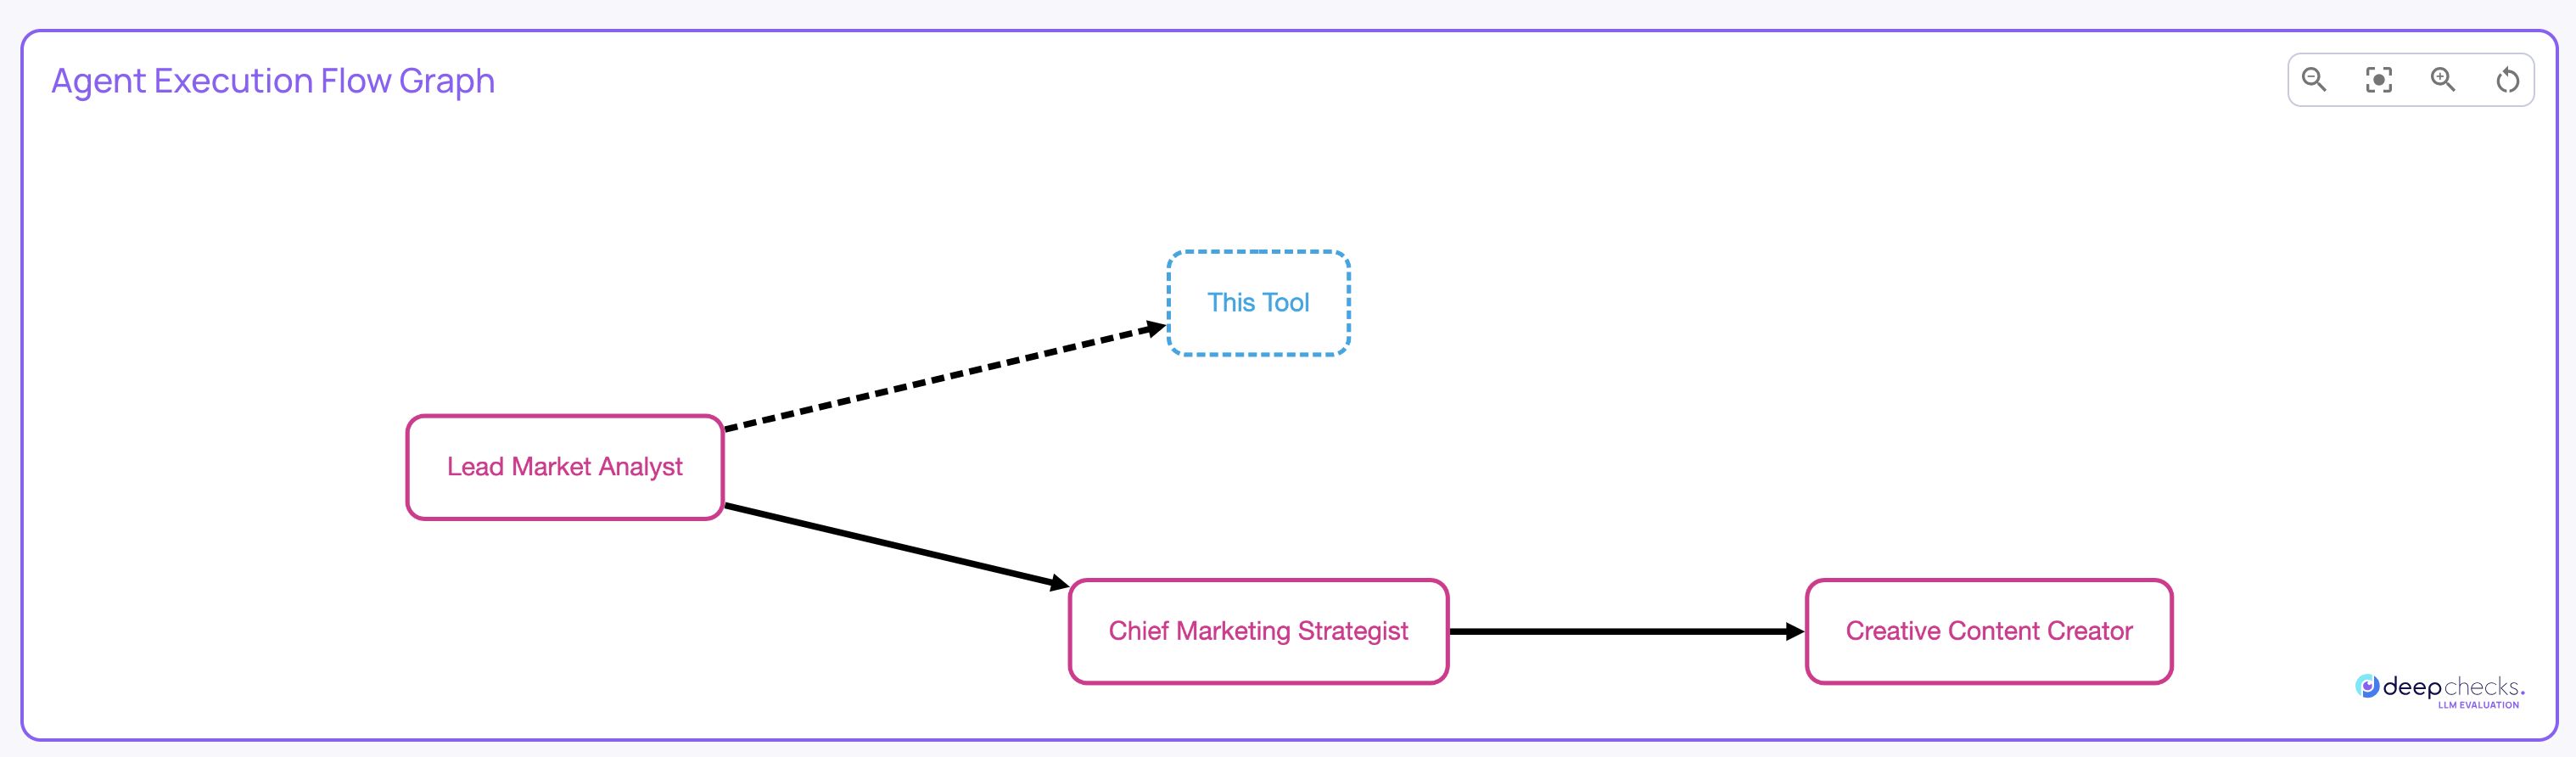
Agent Execution Flow Graph
Agentic pipelines rarely run the way you imagine. Branches appear, loops form, optional steps activate, and agents may select different tools depending on input.
Deepchecks’ Agent Execution Flow Graph gives you a real, aggregated map of how your system actually executes across all traces.
It is generated automatically based on span metadata - no changes needed in instrumentation.
You can use the graph to see:
- Which steps always occur
- Which steps happen only on certain paths
- How often agents loop or branch
- When tools are triggered
- How sub-agents chain together
- Differences between intended design and actual execution
See full details of the agent execution flow graph here.
System-Wide Root-Cause Analysis for Agents
All of Deepchecks’ core RCA features work seamlessly with agentic data:
- Score breakdown across properties, templates, and labels
- Filtering by agent step, tool type, or execution path
- Comparisons across versions, datasets, or model choices
- Highlight the most problematic spans or behaviors
- Drill-downs that connect high-level failures to the exact span causing them
This helps teams quickly understand why an agent struggled not just that it did.
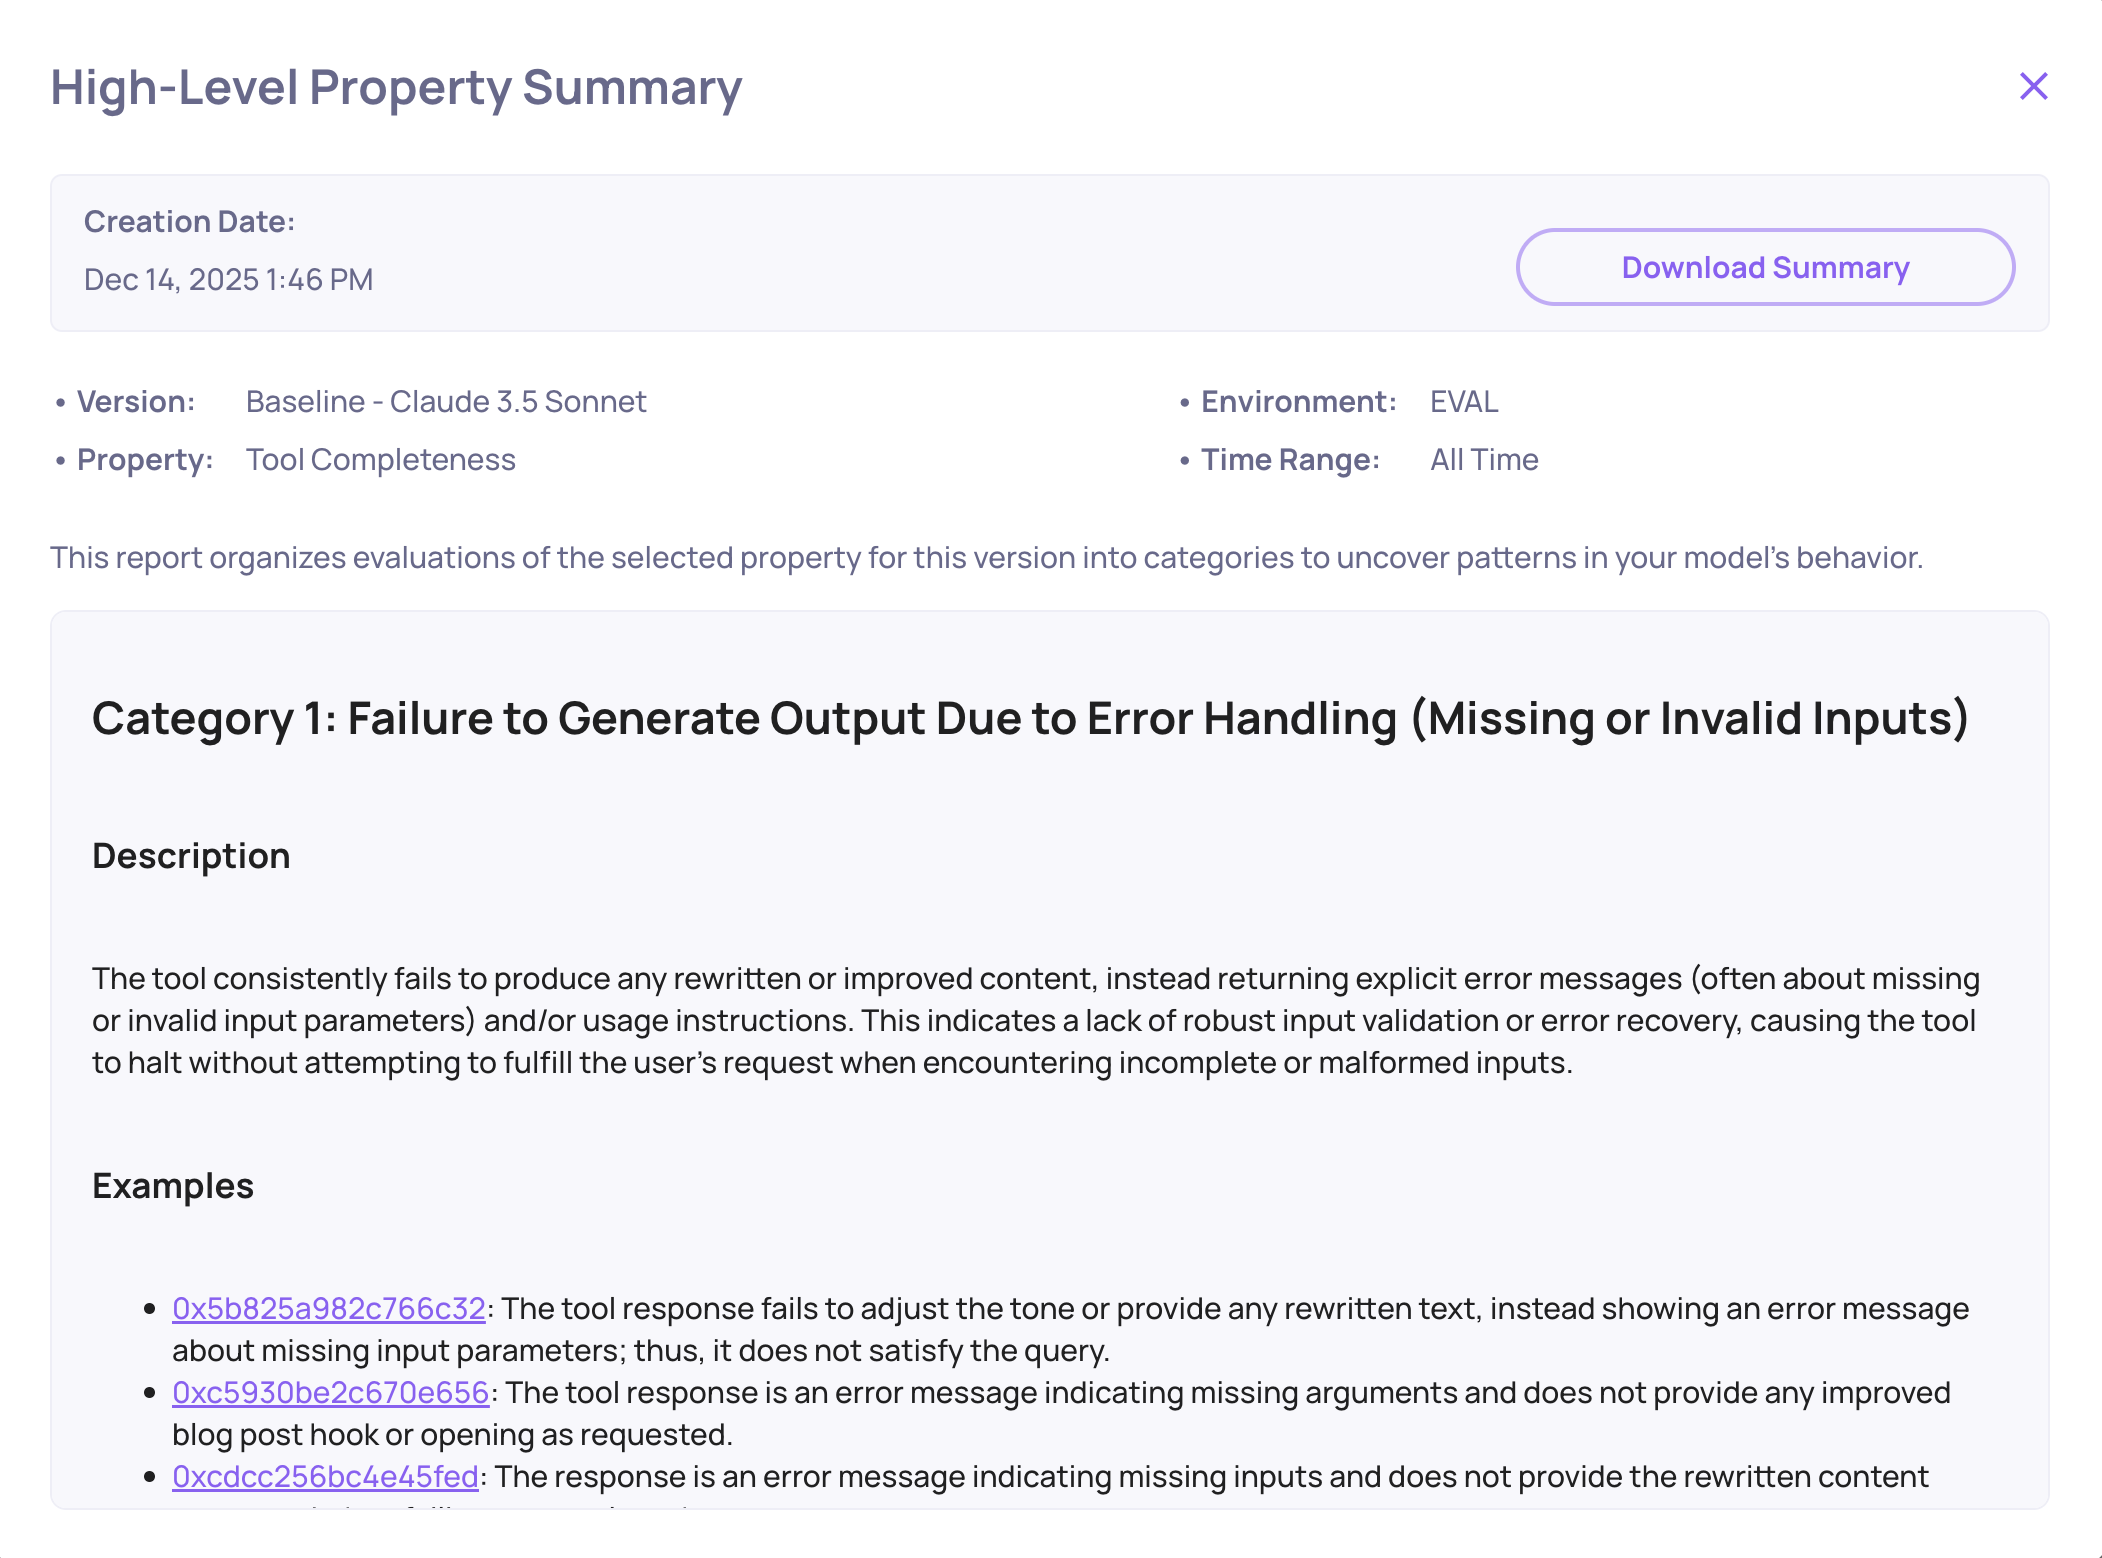
Tool Completeness failure mode analysis example
Together, all these capabilities give teams a complete, purpose-built solution for agent observability and evaluation. By combining automatic tracing, rich built-in interaction types, agent-specific properties, customizable evaluation logic, and visual execution-path analysis, Deepchecks provides both a high-level understanding of agent behavior and the insights needed to improve it. This ensures that developers can trust, monitor, and optimize their agentic workflows with confidence.
Updated about 2 months ago