Production Monitoring
Track your LLM application's performance over time in production - annotation trends, property scores, time-range comparisons, and external integrations.
You have investigated failures with Root Cause Analysis, built datasets to test against, compared versions to pick the best implementation, and assessed cost trade-offs. Now you deploy. This page covers what happens next: monitoring your application's quality in production over time.
When you integrate your data from a production environment (env_type=PROD), Deepchecks runs the same evaluation pipeline - calculating properties, assigning annotations, and computing system metrics. The production Overview screen then tracks these signals over time so you can detect degradation before your users do.
The production Overview
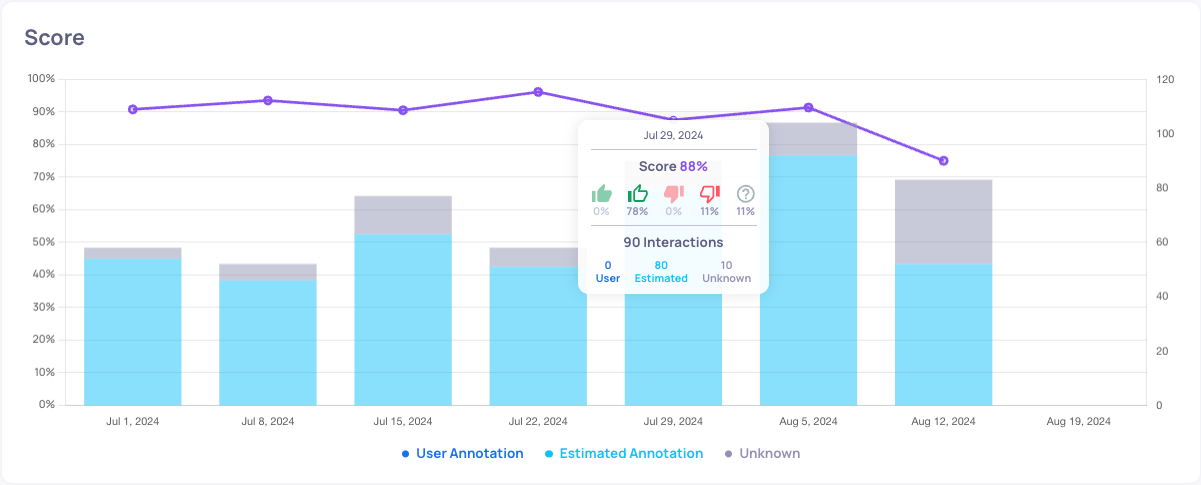
In the production environment, the Overview screen shows your application's behavior over time:
- Annotation trends - The distribution of Good, Bad, and Unknown labels across time, with total sample counts
- Property score averages - How each property is performing across your production traffic
- Property score trends - How scores change over time, so you can detect gradual degradation
Toggle between average scores and trend views at the bottom of the Overview screen to understand which properties have the greatest impact on performance.
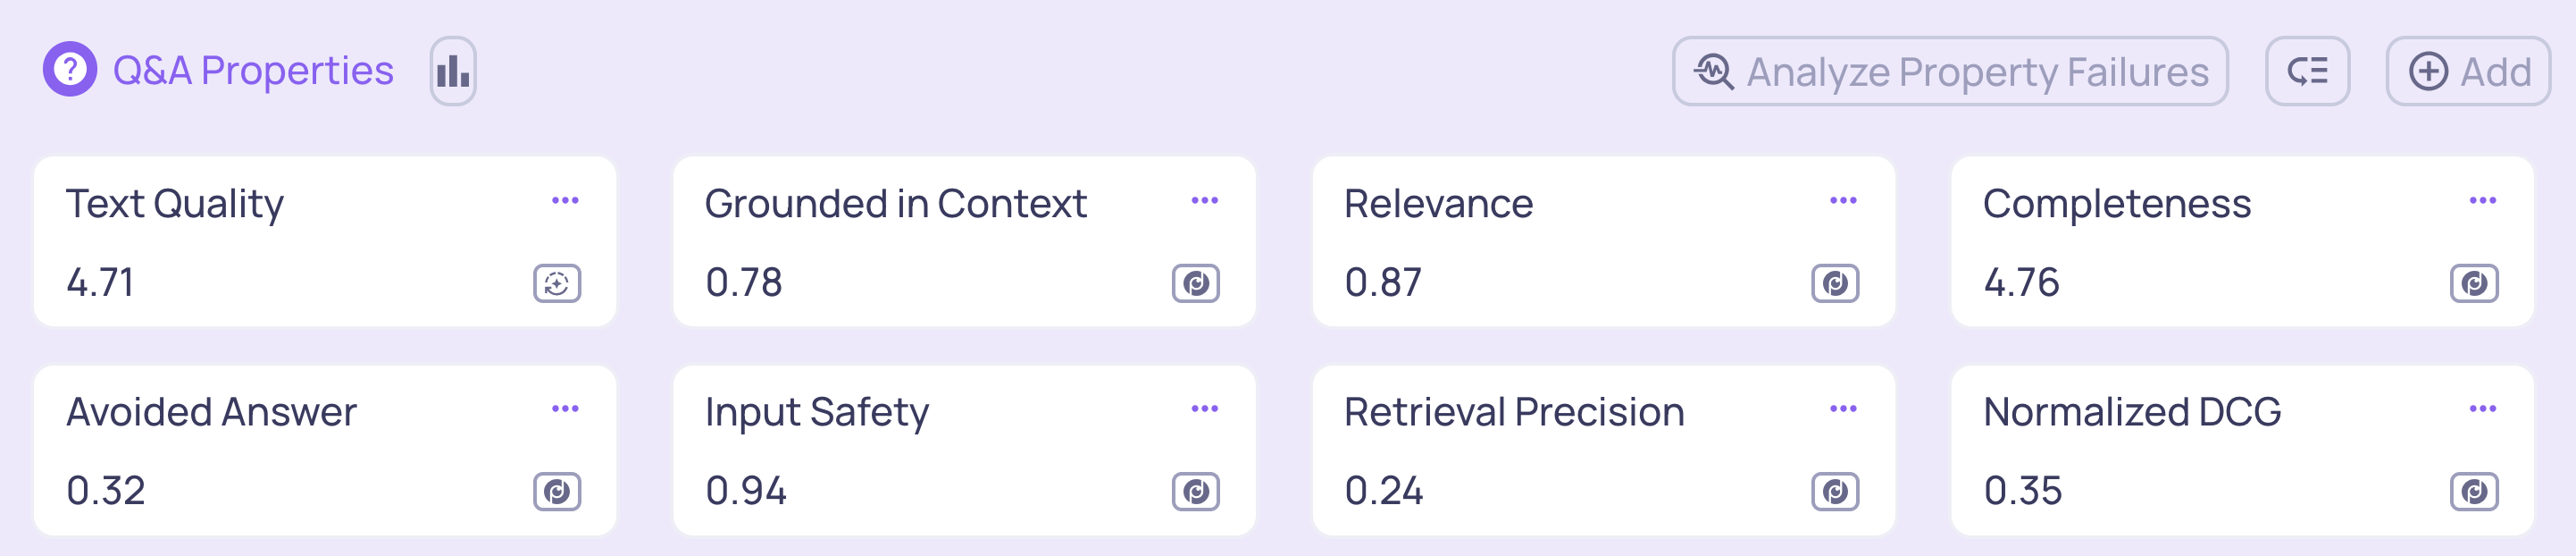
Average property scores view
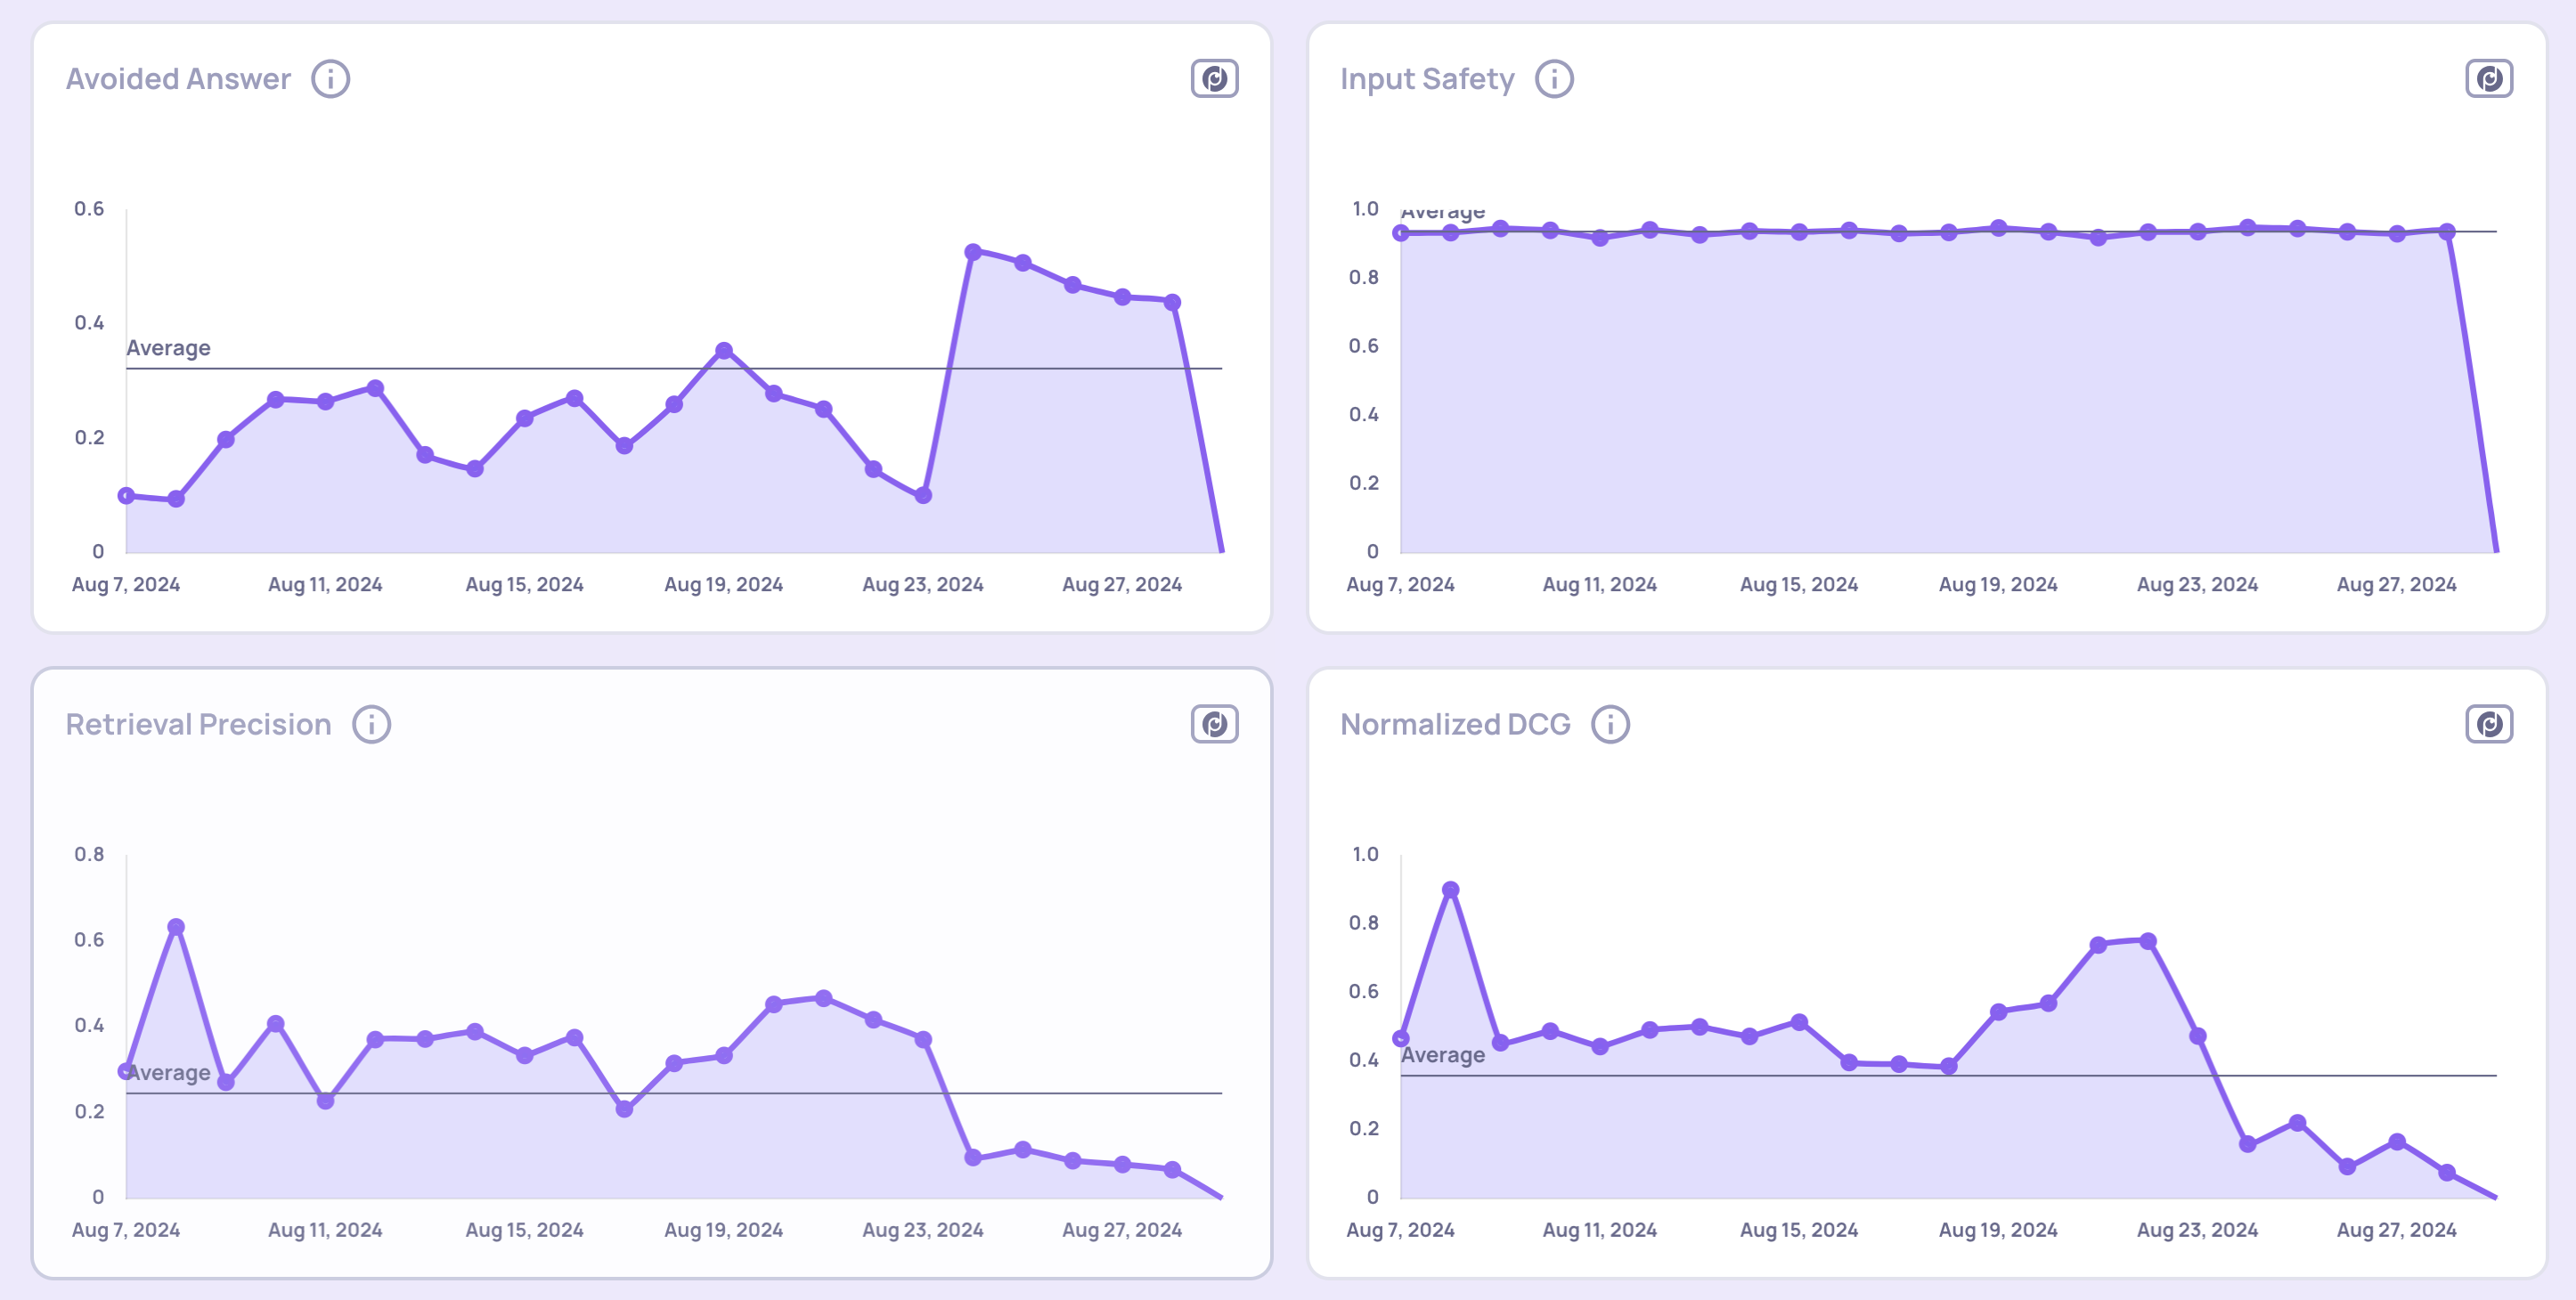
Property score trends view
Root cause analysis in production
The same Root Cause Analysis tools available for evaluation data work in production too:
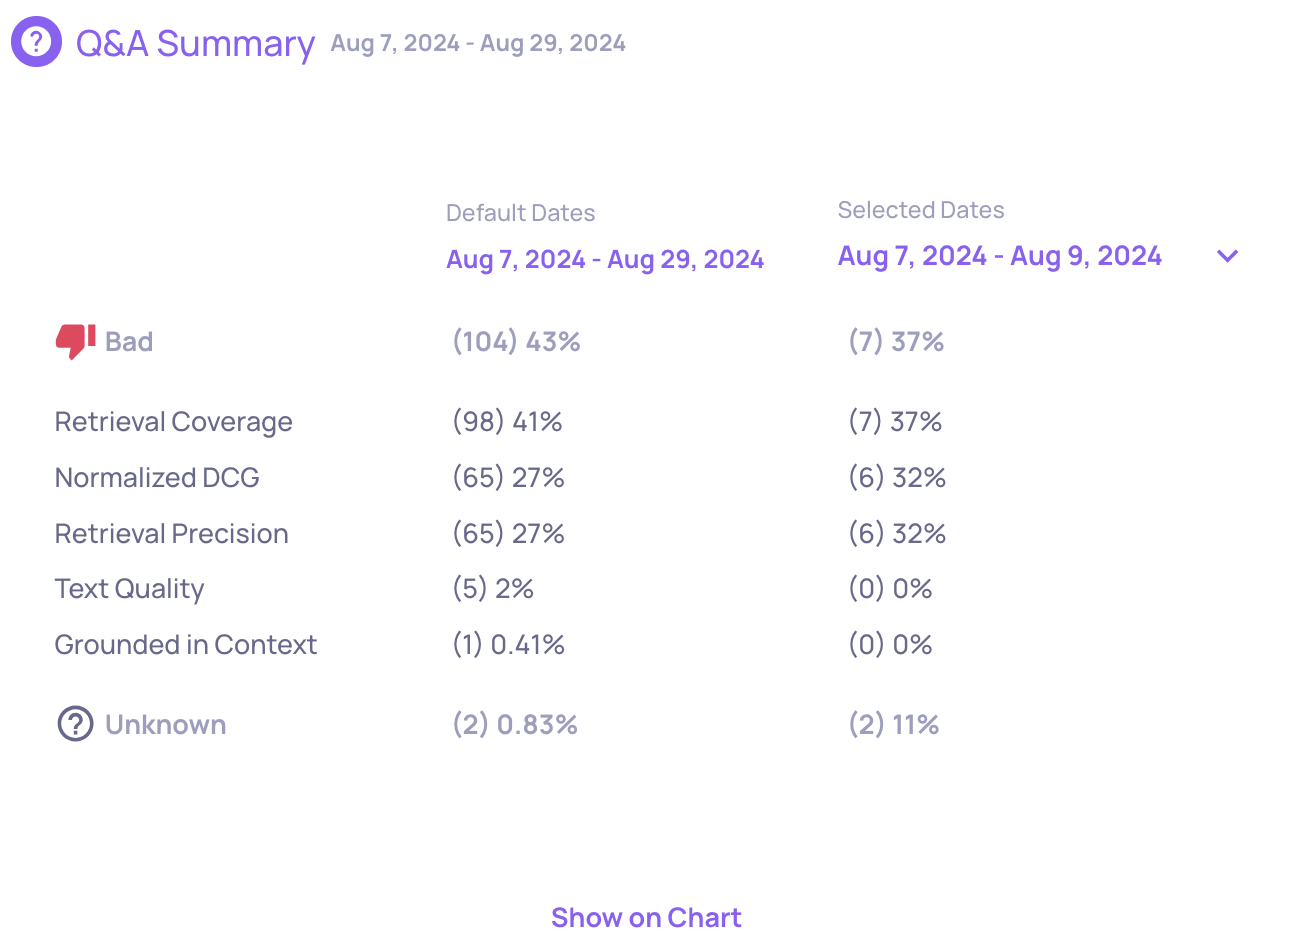
Score breakdown comparison
Compare the distribution of annotation scores across two different time ranges within production. This helps you identify when performance changed and which properties contributed to the shift.
Interaction-type level insights
Run automated insights on production data within a selected time window. This analyzes data at the interaction-type level and highlights patterns, anomalies, and contributing factors to performance shifts.
Monitoring with external tools
In addition to the built-in monitoring, Deepchecks integrates with external observability platforms so you can incorporate LLM quality into your existing alerting workflows:
- Datadog - Send annotation scores and property metrics to Datadog dashboards
- New Relic - Forward metrics to New Relic for unified monitoring
- Custom integrations - Use the SDK or webhook support to send data to any external system
What's next
When production monitoring reveals degradation, the improvement loop starts again: investigate with Root Cause Analysis, add failure cases to your datasets, build a new version, and compare it against the current one.
For step-by-step workflows on specific tasks, see the Guides section.
Updated 4 months ago