Navigating the UI
A guide to every screen in the Deepchecks UI - what it shows, when to use it, and how it fits into your evaluation workflow.
This page is a quick reference for every screen in the Deepchecks UI. If you are not sure where to find something, start here.
The UI is organized into three levels:
- Version-level screens - show data for a specific version within an environment (Overview, Sessions, Interactions, Storage)
- Application-level screens - operate across versions or configure the application (Versions, Datasets, Simulations, Properties, Interaction Types)
- Organization-level screens - manage workspace-wide settings and applications (Workspace Settings, Manage Applications)
Version-Level Screens
These screens show the data for a specific version and environment. Select an application and then a version to access them.
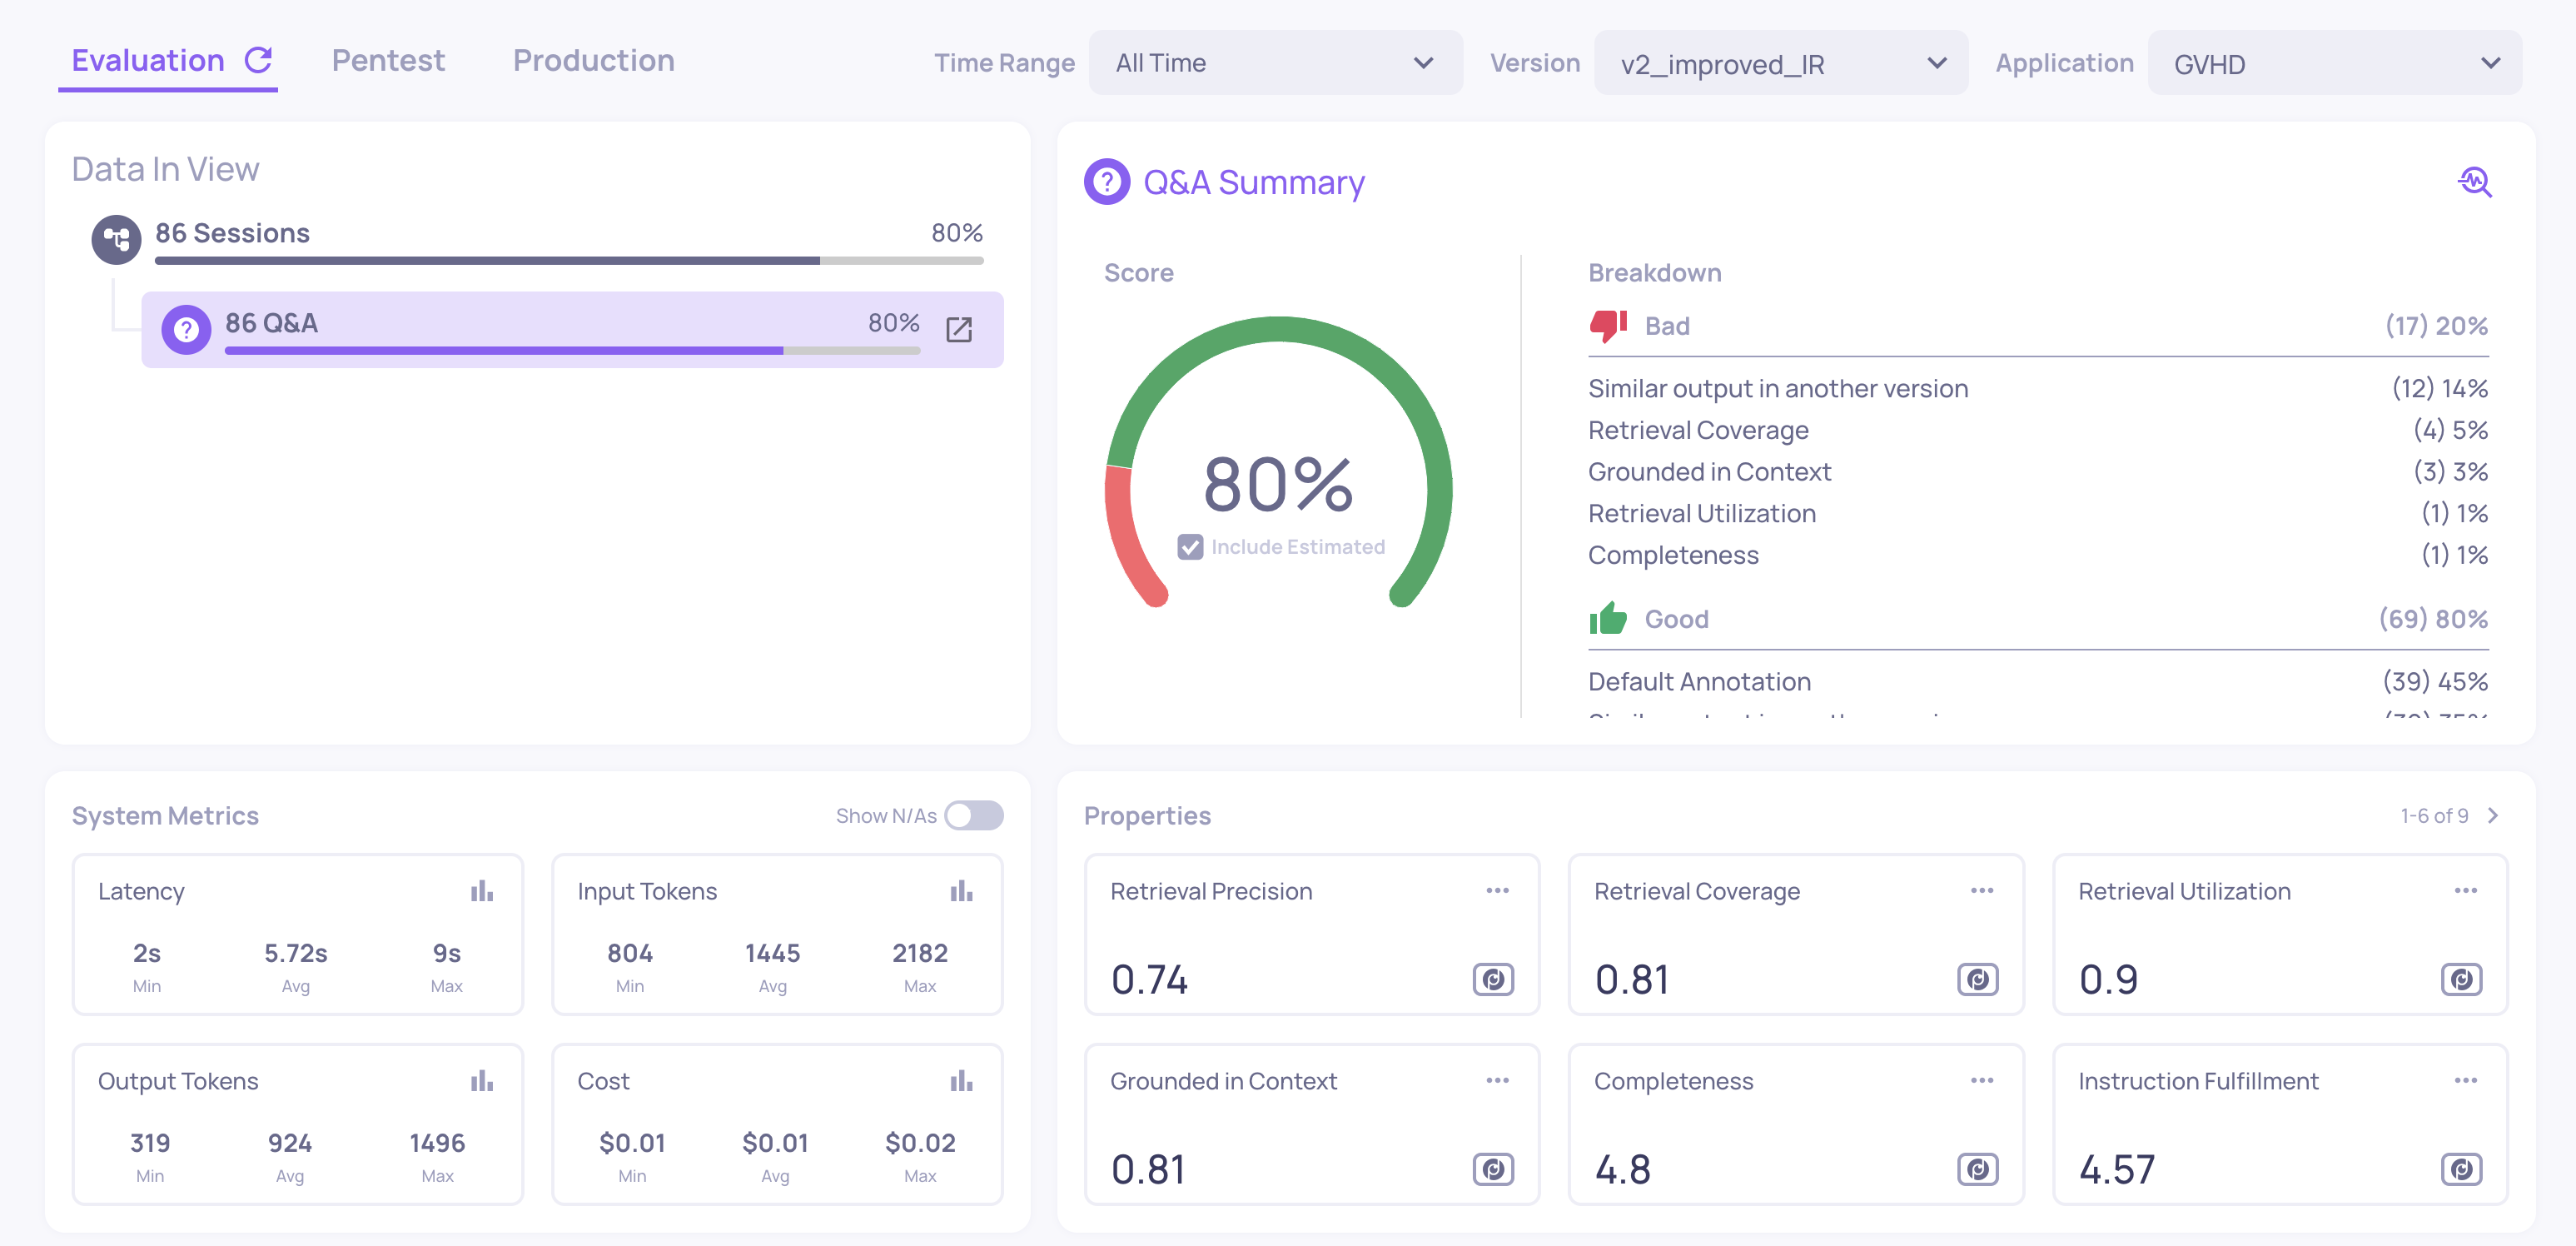
Overview
Where: Select an application > select a version
The main dashboard for a specific version. This is your primary landing screen for evaluation results. It shows:
- Annotation summary - the distribution of Good, Bad, and Unknown labels (filled badges for human annotations, outlined badges for estimated)
- Properties summary - average scores for all enabled properties, with anomalous values highlighted
- System metrics summary - total and average latency, token usage, and cost across all interactions in this version
- Property trends - how scores are distributed across the interaction set
Use this screen to get an immediate health check on a version before drilling deeper.
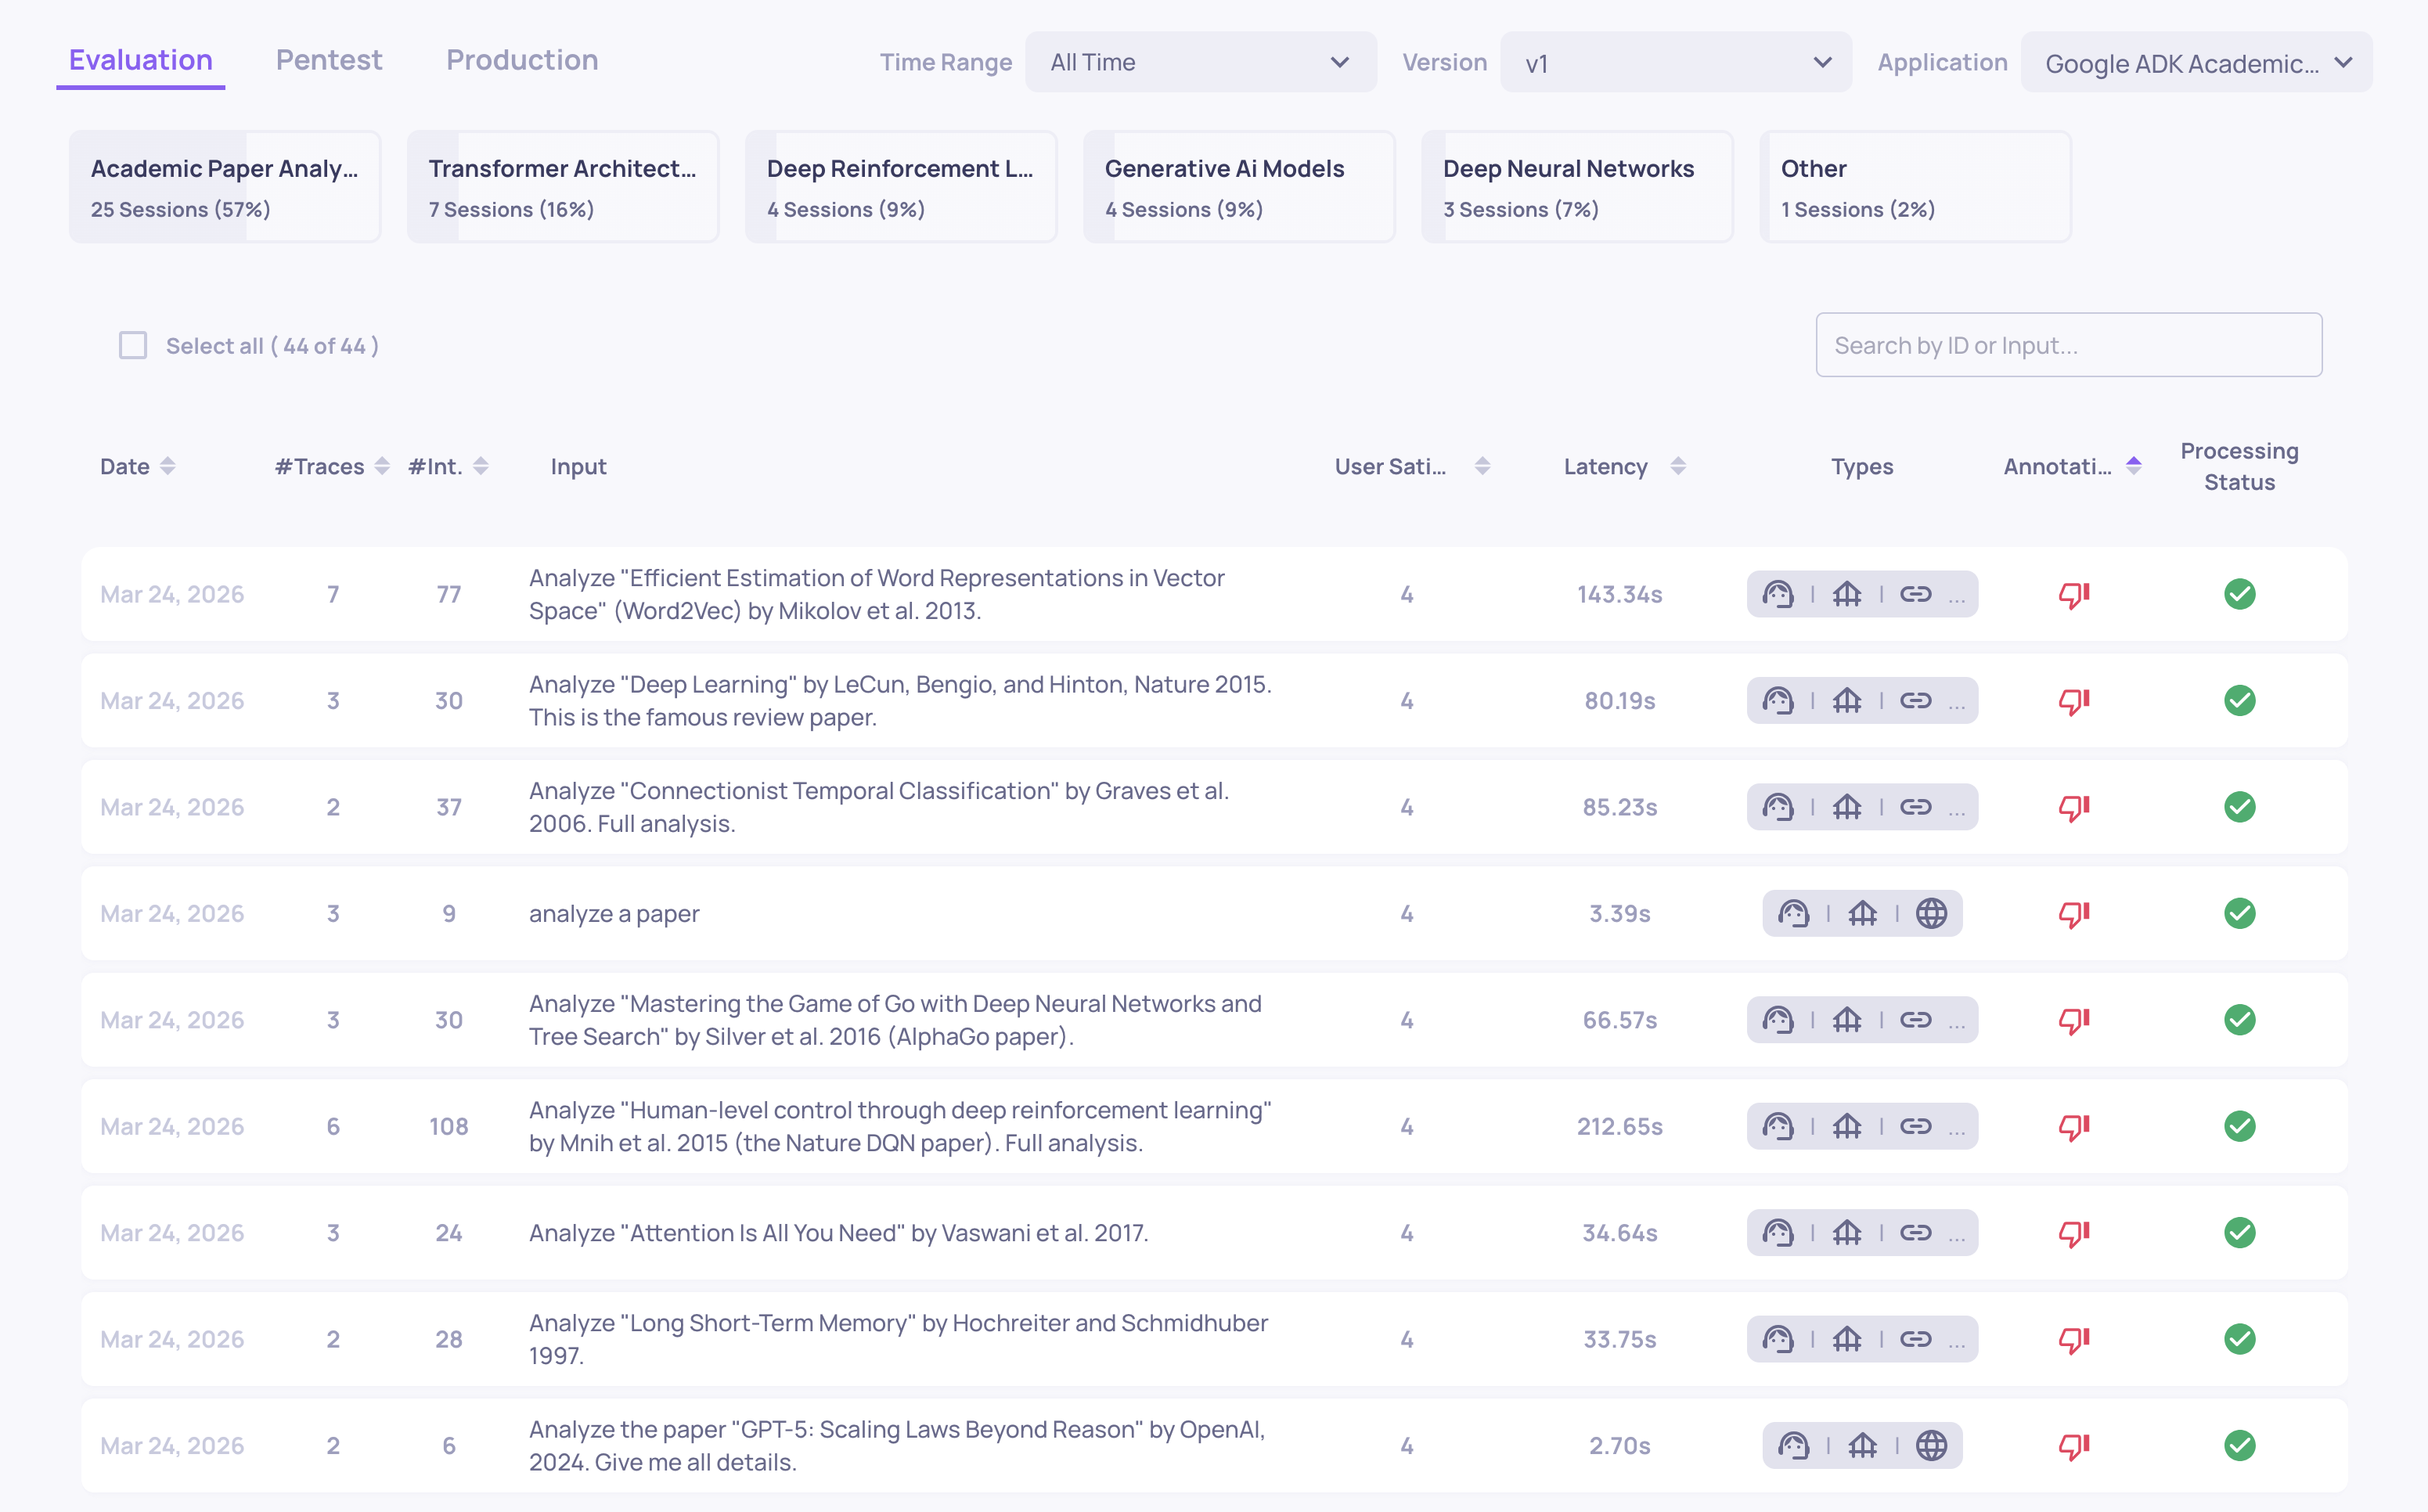
Sessions
Where: Left sidebar > Sessions
Shows your interactions grouped by session - each session represents a complete user flow (a multi-turn conversation, an agent run, or a sequence of related interactions).
For each session you can see:
- Session ID and topic
- The aggregated session-level annotation
- Session-level property scores (e.g., Intent Fulfillment across the full conversation)
- System metrics aggregated across the session
Click a session to open the single session view, where you see the full trace hierarchy - the root span, child agents, tool calls, and LLM calls - with scores at each level.
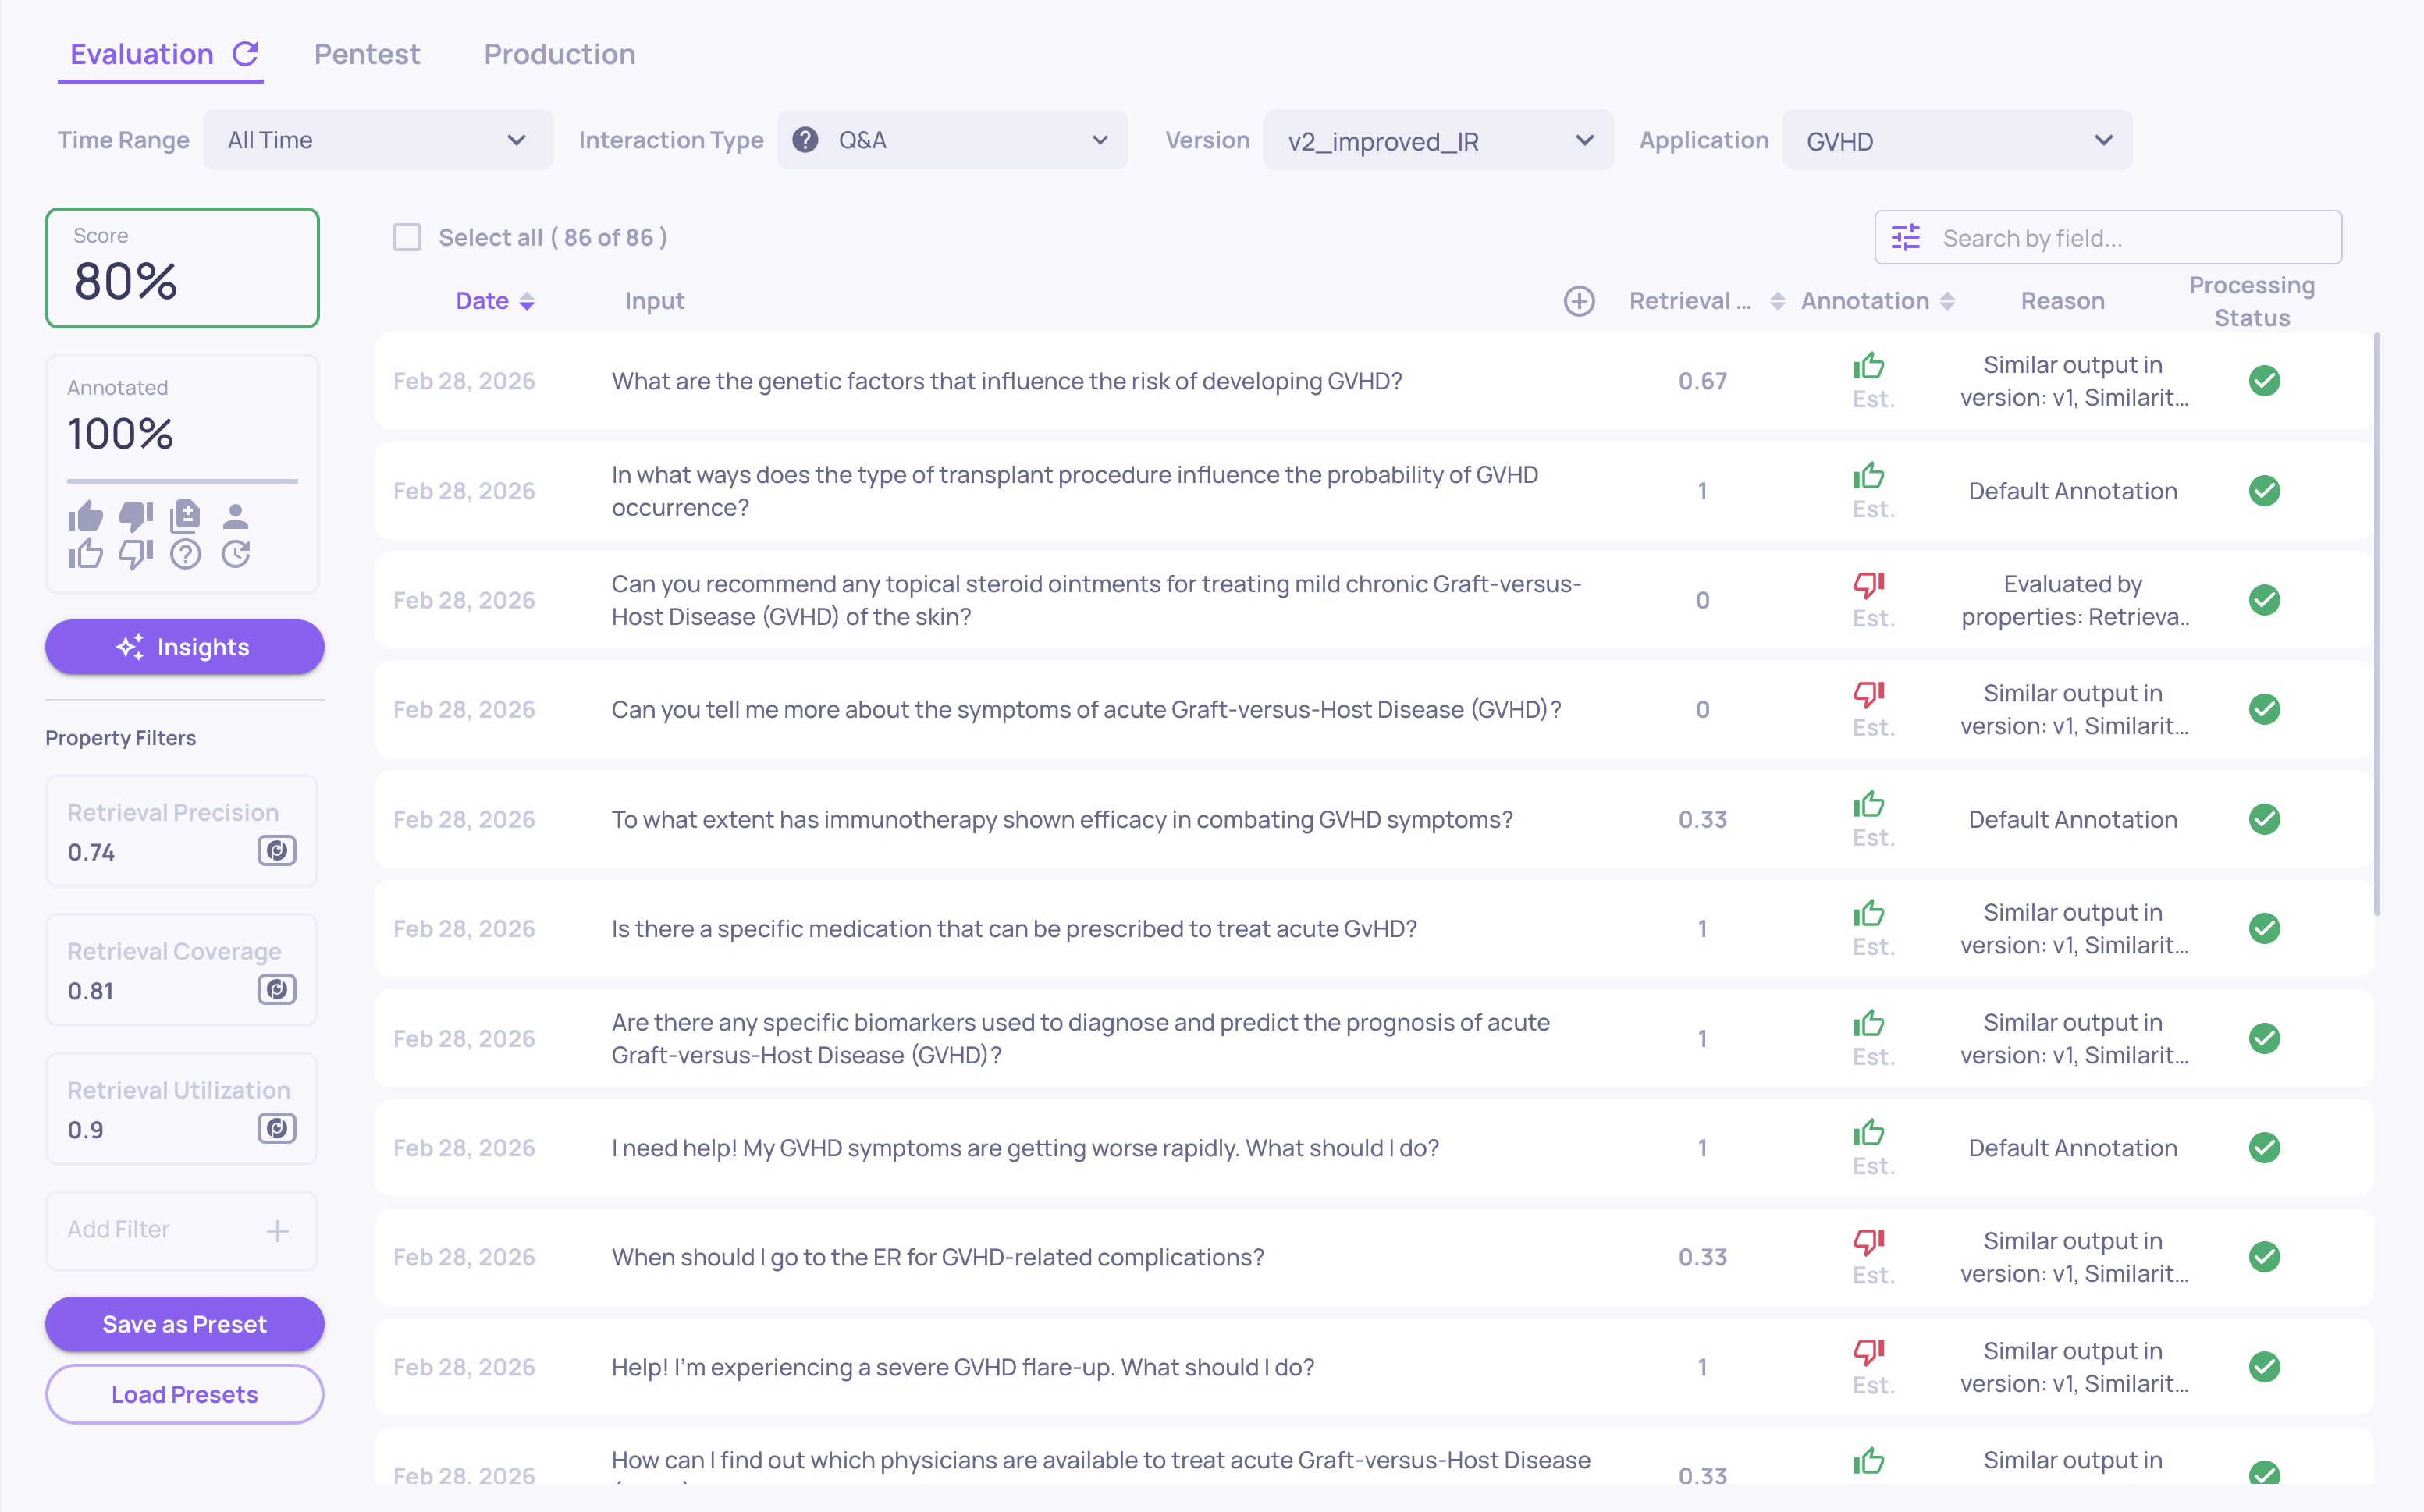
Interactions
Where: Left sidebar > Interactions
A table of every interaction in the current version and environment. Each row shows the input, output, annotation status, interaction type, key property scores, and system metrics (latency, tokens, cost).
From here you can:
- Filter by property score, annotation, interaction type, topic, date range, system metric, or any custom field
- Sort by any column to surface the worst-performing interactions
- Save filter combinations as views for quick access later
- Click any row to open the full interaction detail view, showing all property scores with explanations, the raw input/output, and annotation controls
This is the primary screen for finding specific failures, reviewing individual interactions, and adding manual annotations.
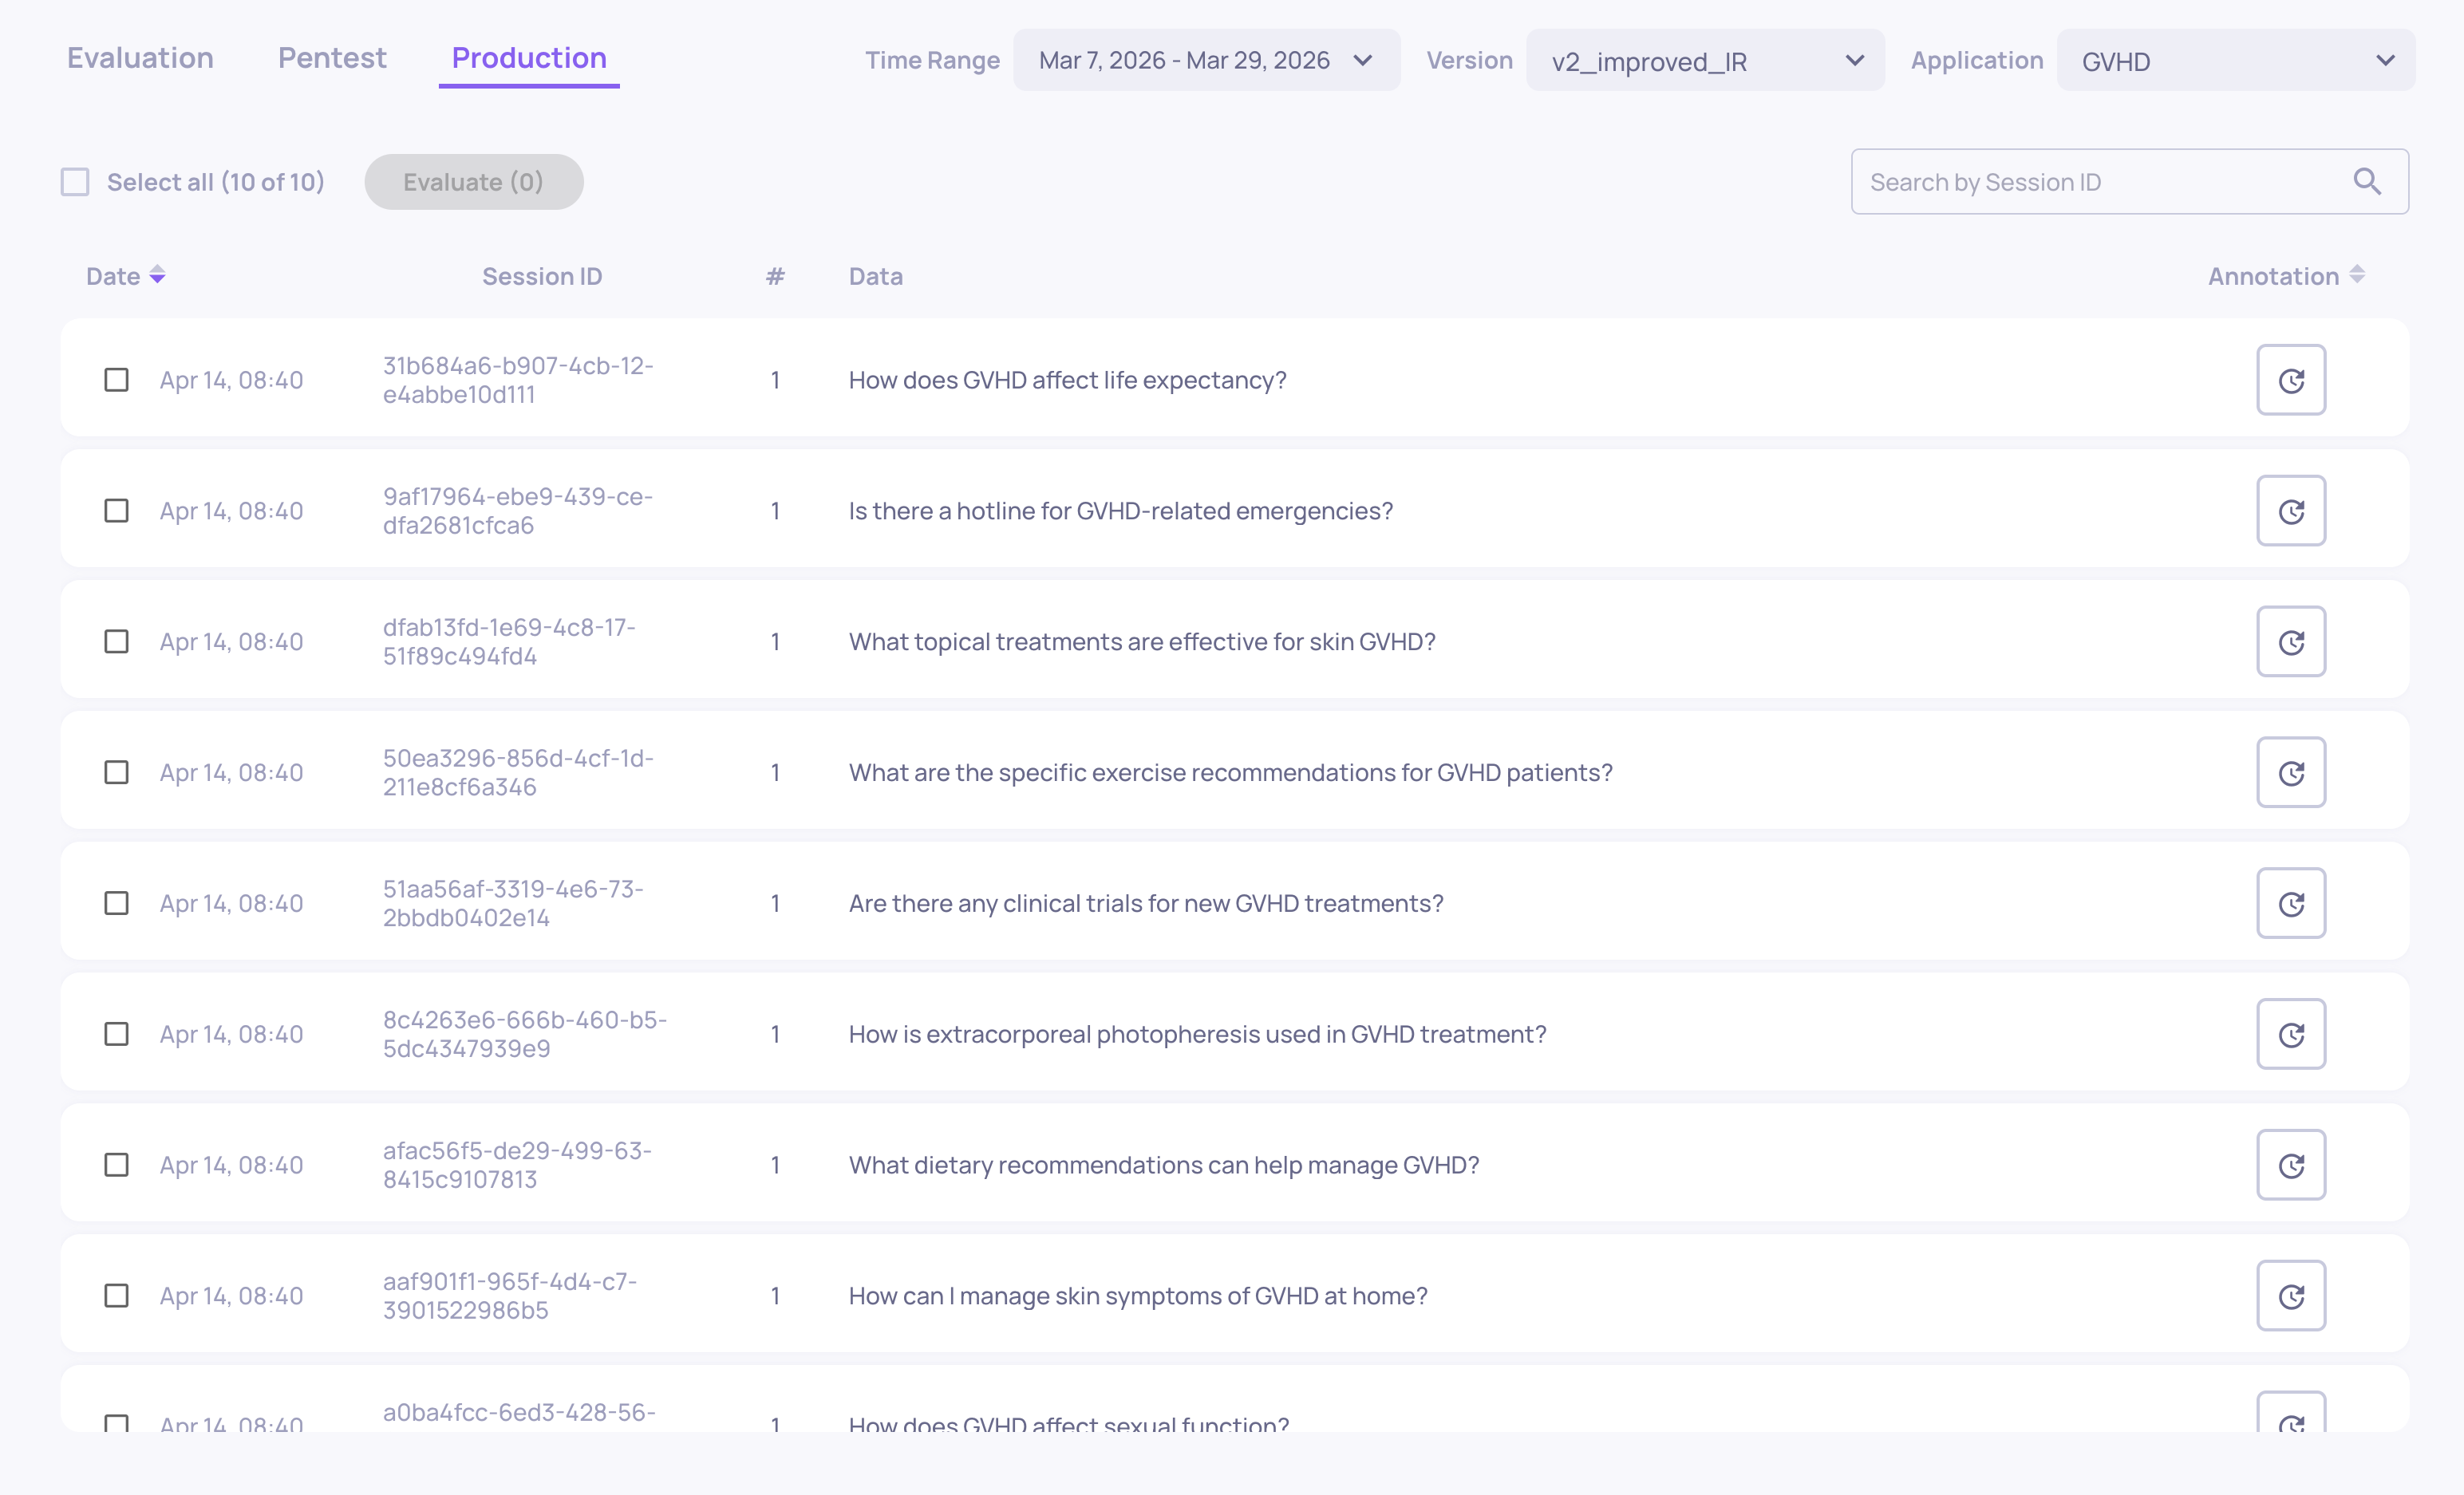
Storage
Where: Left sidebar > Storage
Shows interactions that were received but not selected for evaluation (due to sampling). These are stored as raw data - you can browse them, inspect the input/output, and selectively send individual sessions for full evaluation if something looks interesting.
Application-Level Screens
These screens operate across versions or configure how the application evaluates data.
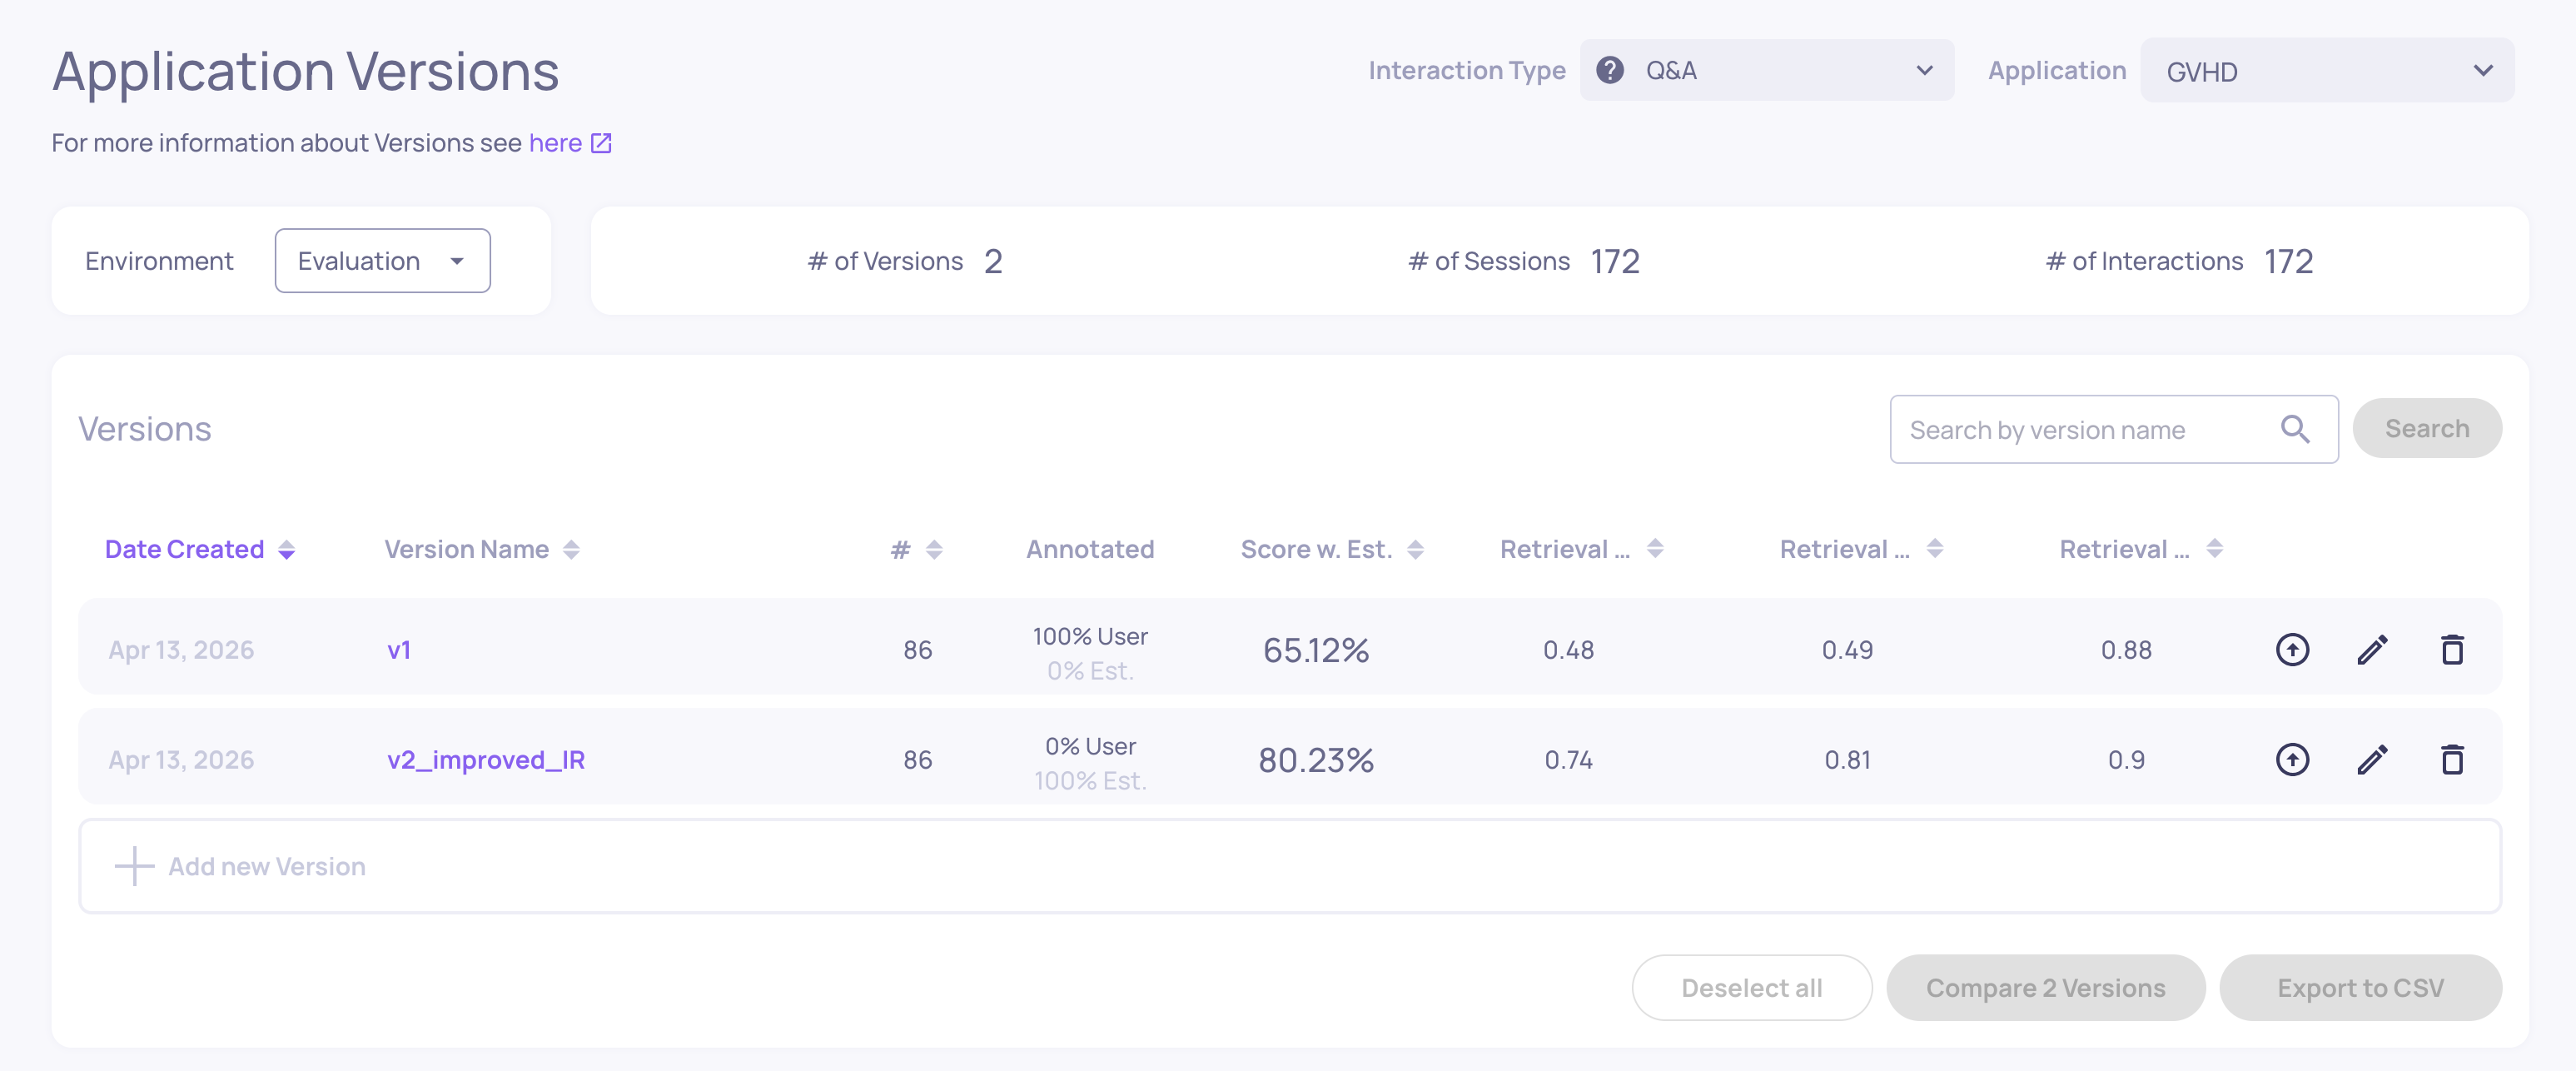
Versions
Where: Left sidebar > Versions
Lists all versions within the current application. For each version you can see:
- The combined quality score (based on pinned properties and annotations)
- Annotation distribution (Good/Bad/Unknown)
- Average values for pinned properties
- System metrics (latency, tokens, cost)
- Star ratings for quick comparison
From here you can compare two or more versions side by side, looking at property scores, annotation distributions, and system metrics to decide which version performs best.
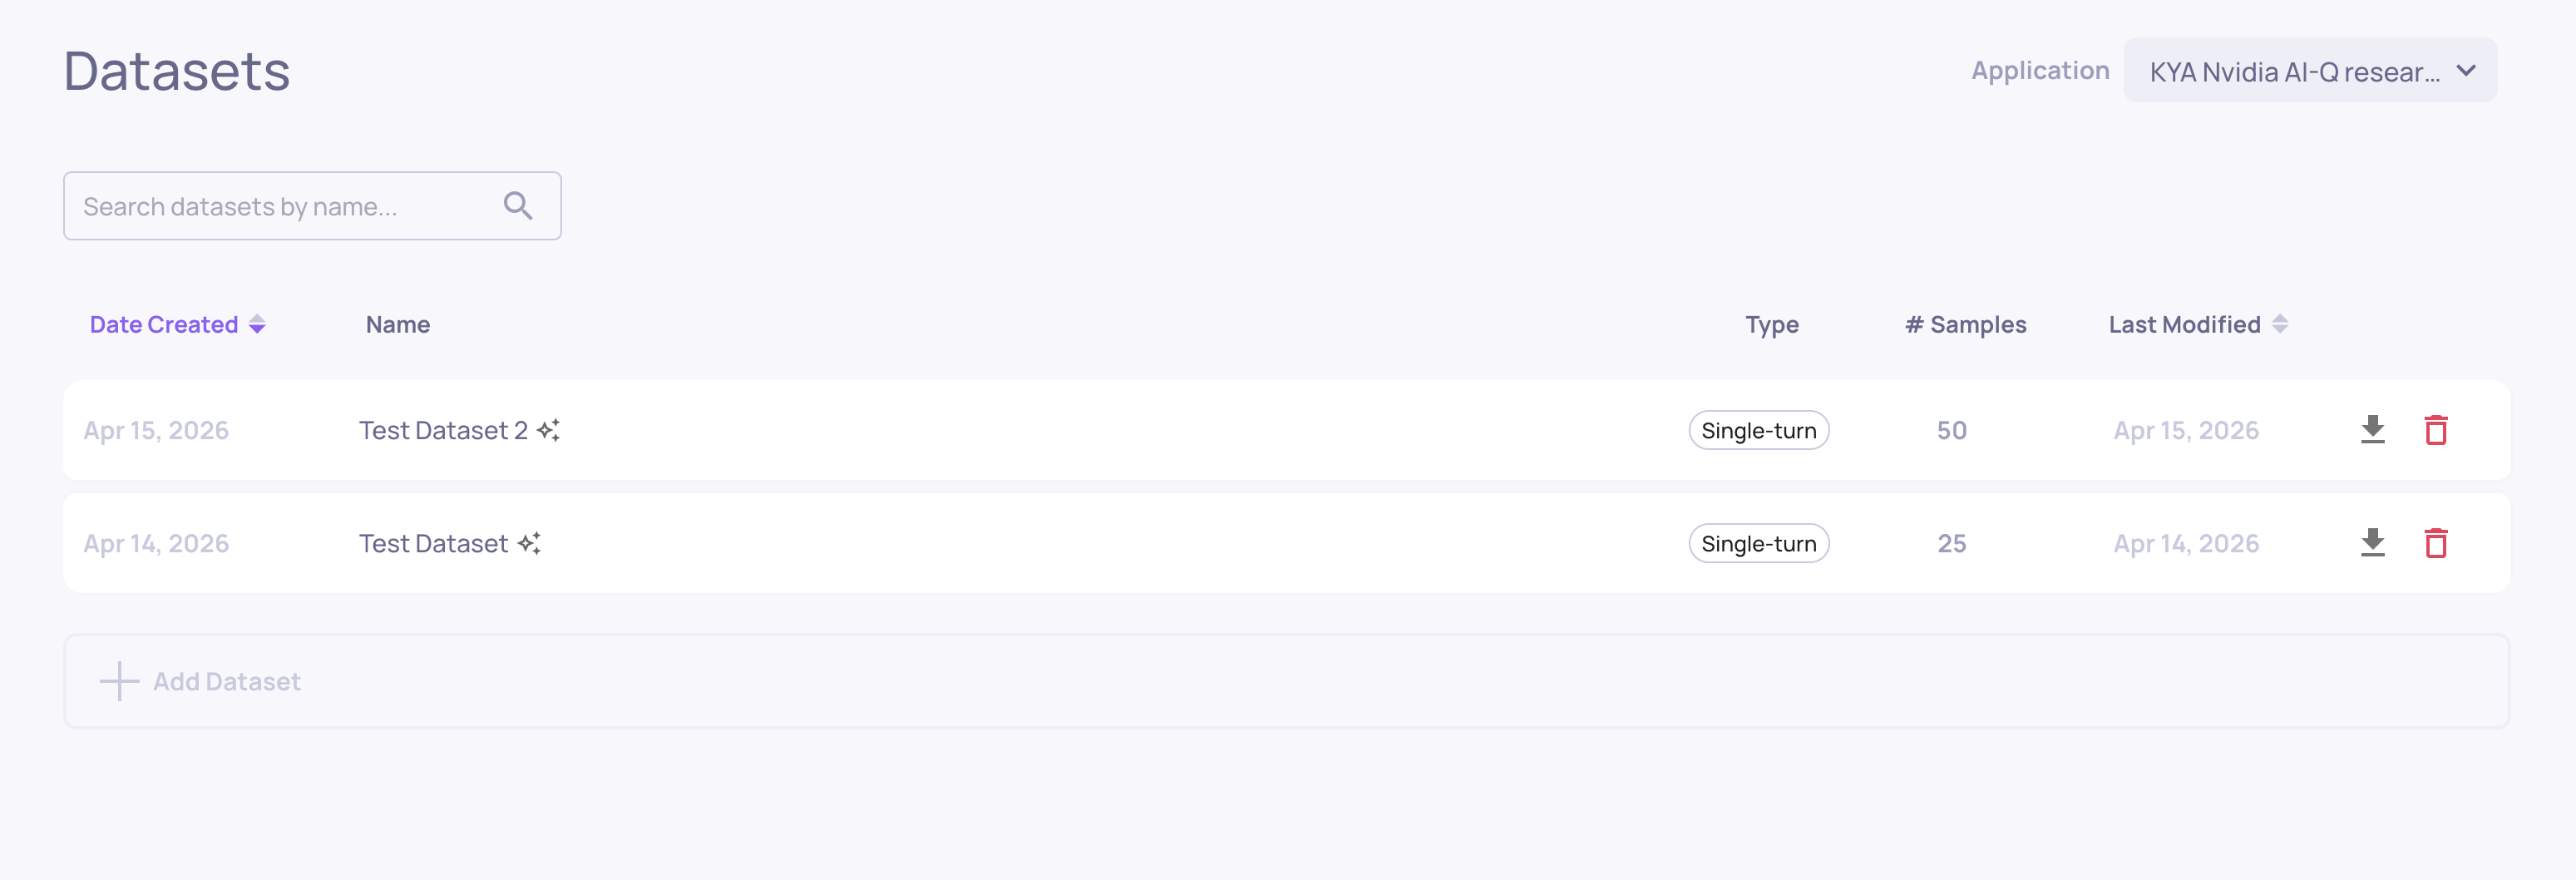
Datasets
Where: Left sidebar > Datasets
Where you manage named, curated evaluation sets. From here you can:
-
Create a new dataset by uploading CSV or JSONL files
-
Clone interactions from production or evaluation data into a dataset
-
Generate synthetic test cases using AI data generation
-
Run a dataset against a version to get fresh evaluation results
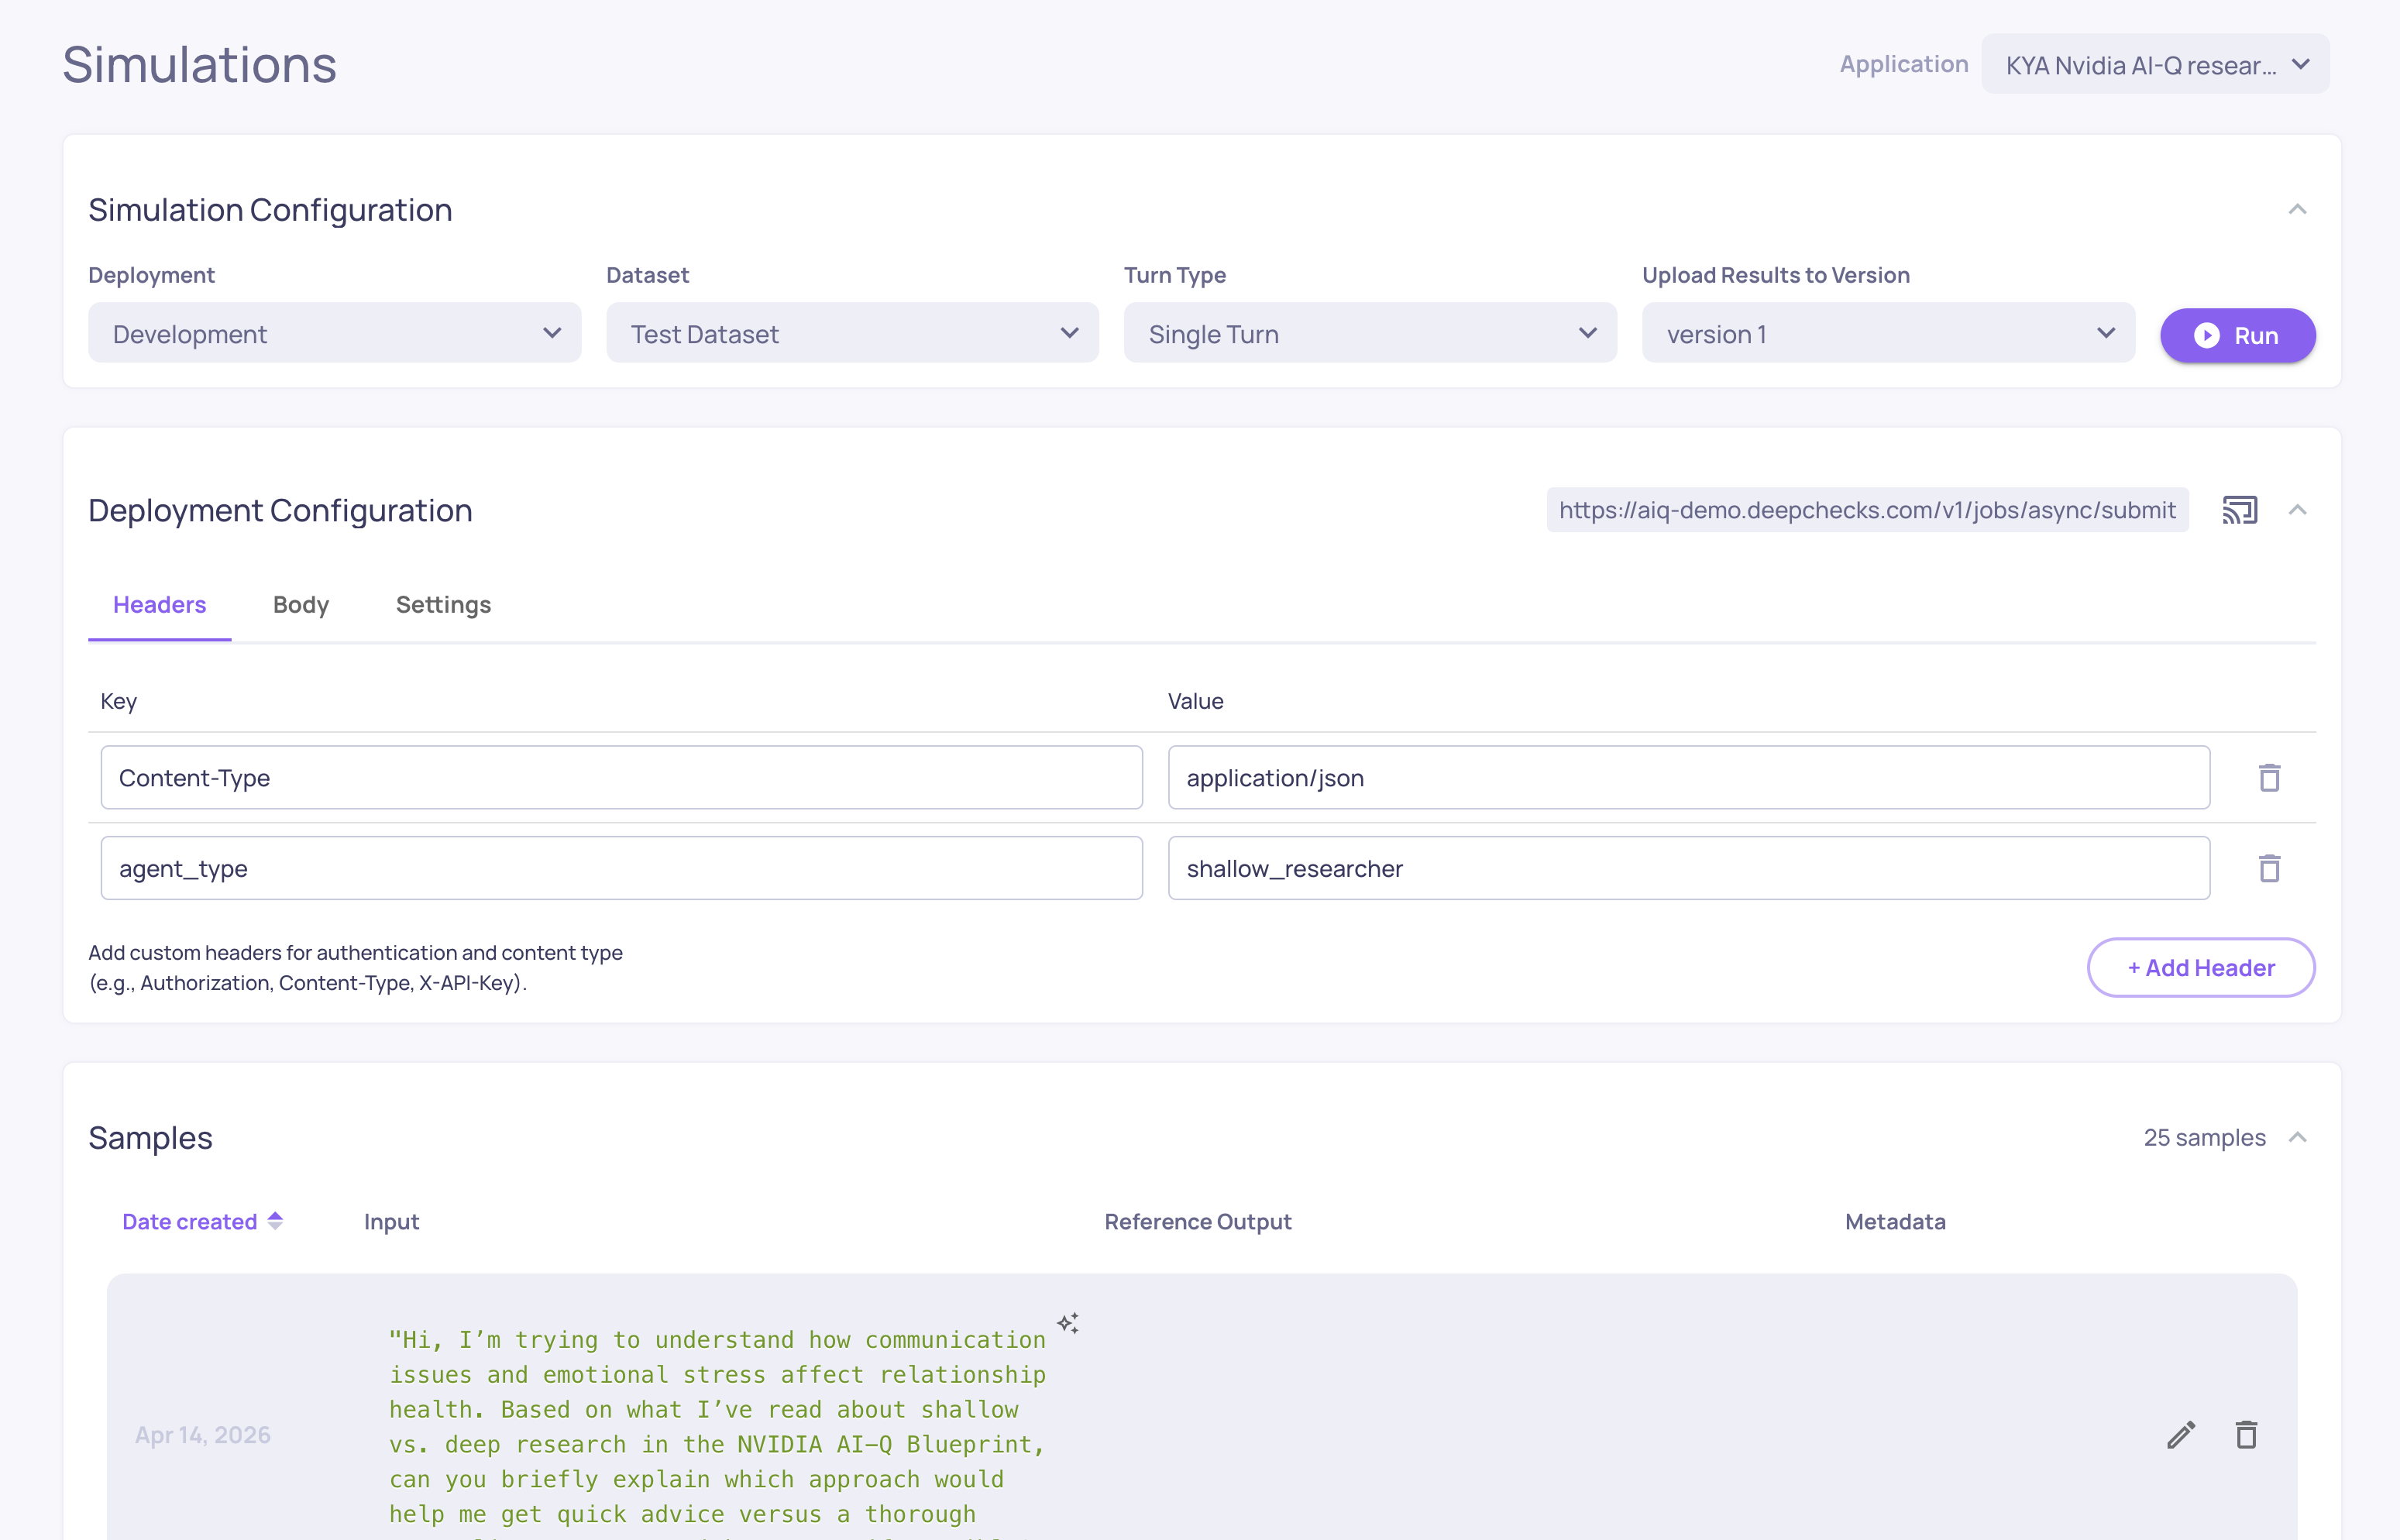
Simulations
Where: Left sidebar > Simulations
The KYA (Know Your Agent) simulation environment. Connect your agent's endpoint, generate test scenarios, and trigger your agent against them automatically - capturing every span and evaluating the results.
From here you can:
-
Configure your agent's deployment endpoint
-
Generate or upload test datasets
-
Run simulations and track their progress
-
View simulation results in the standard evaluation screens
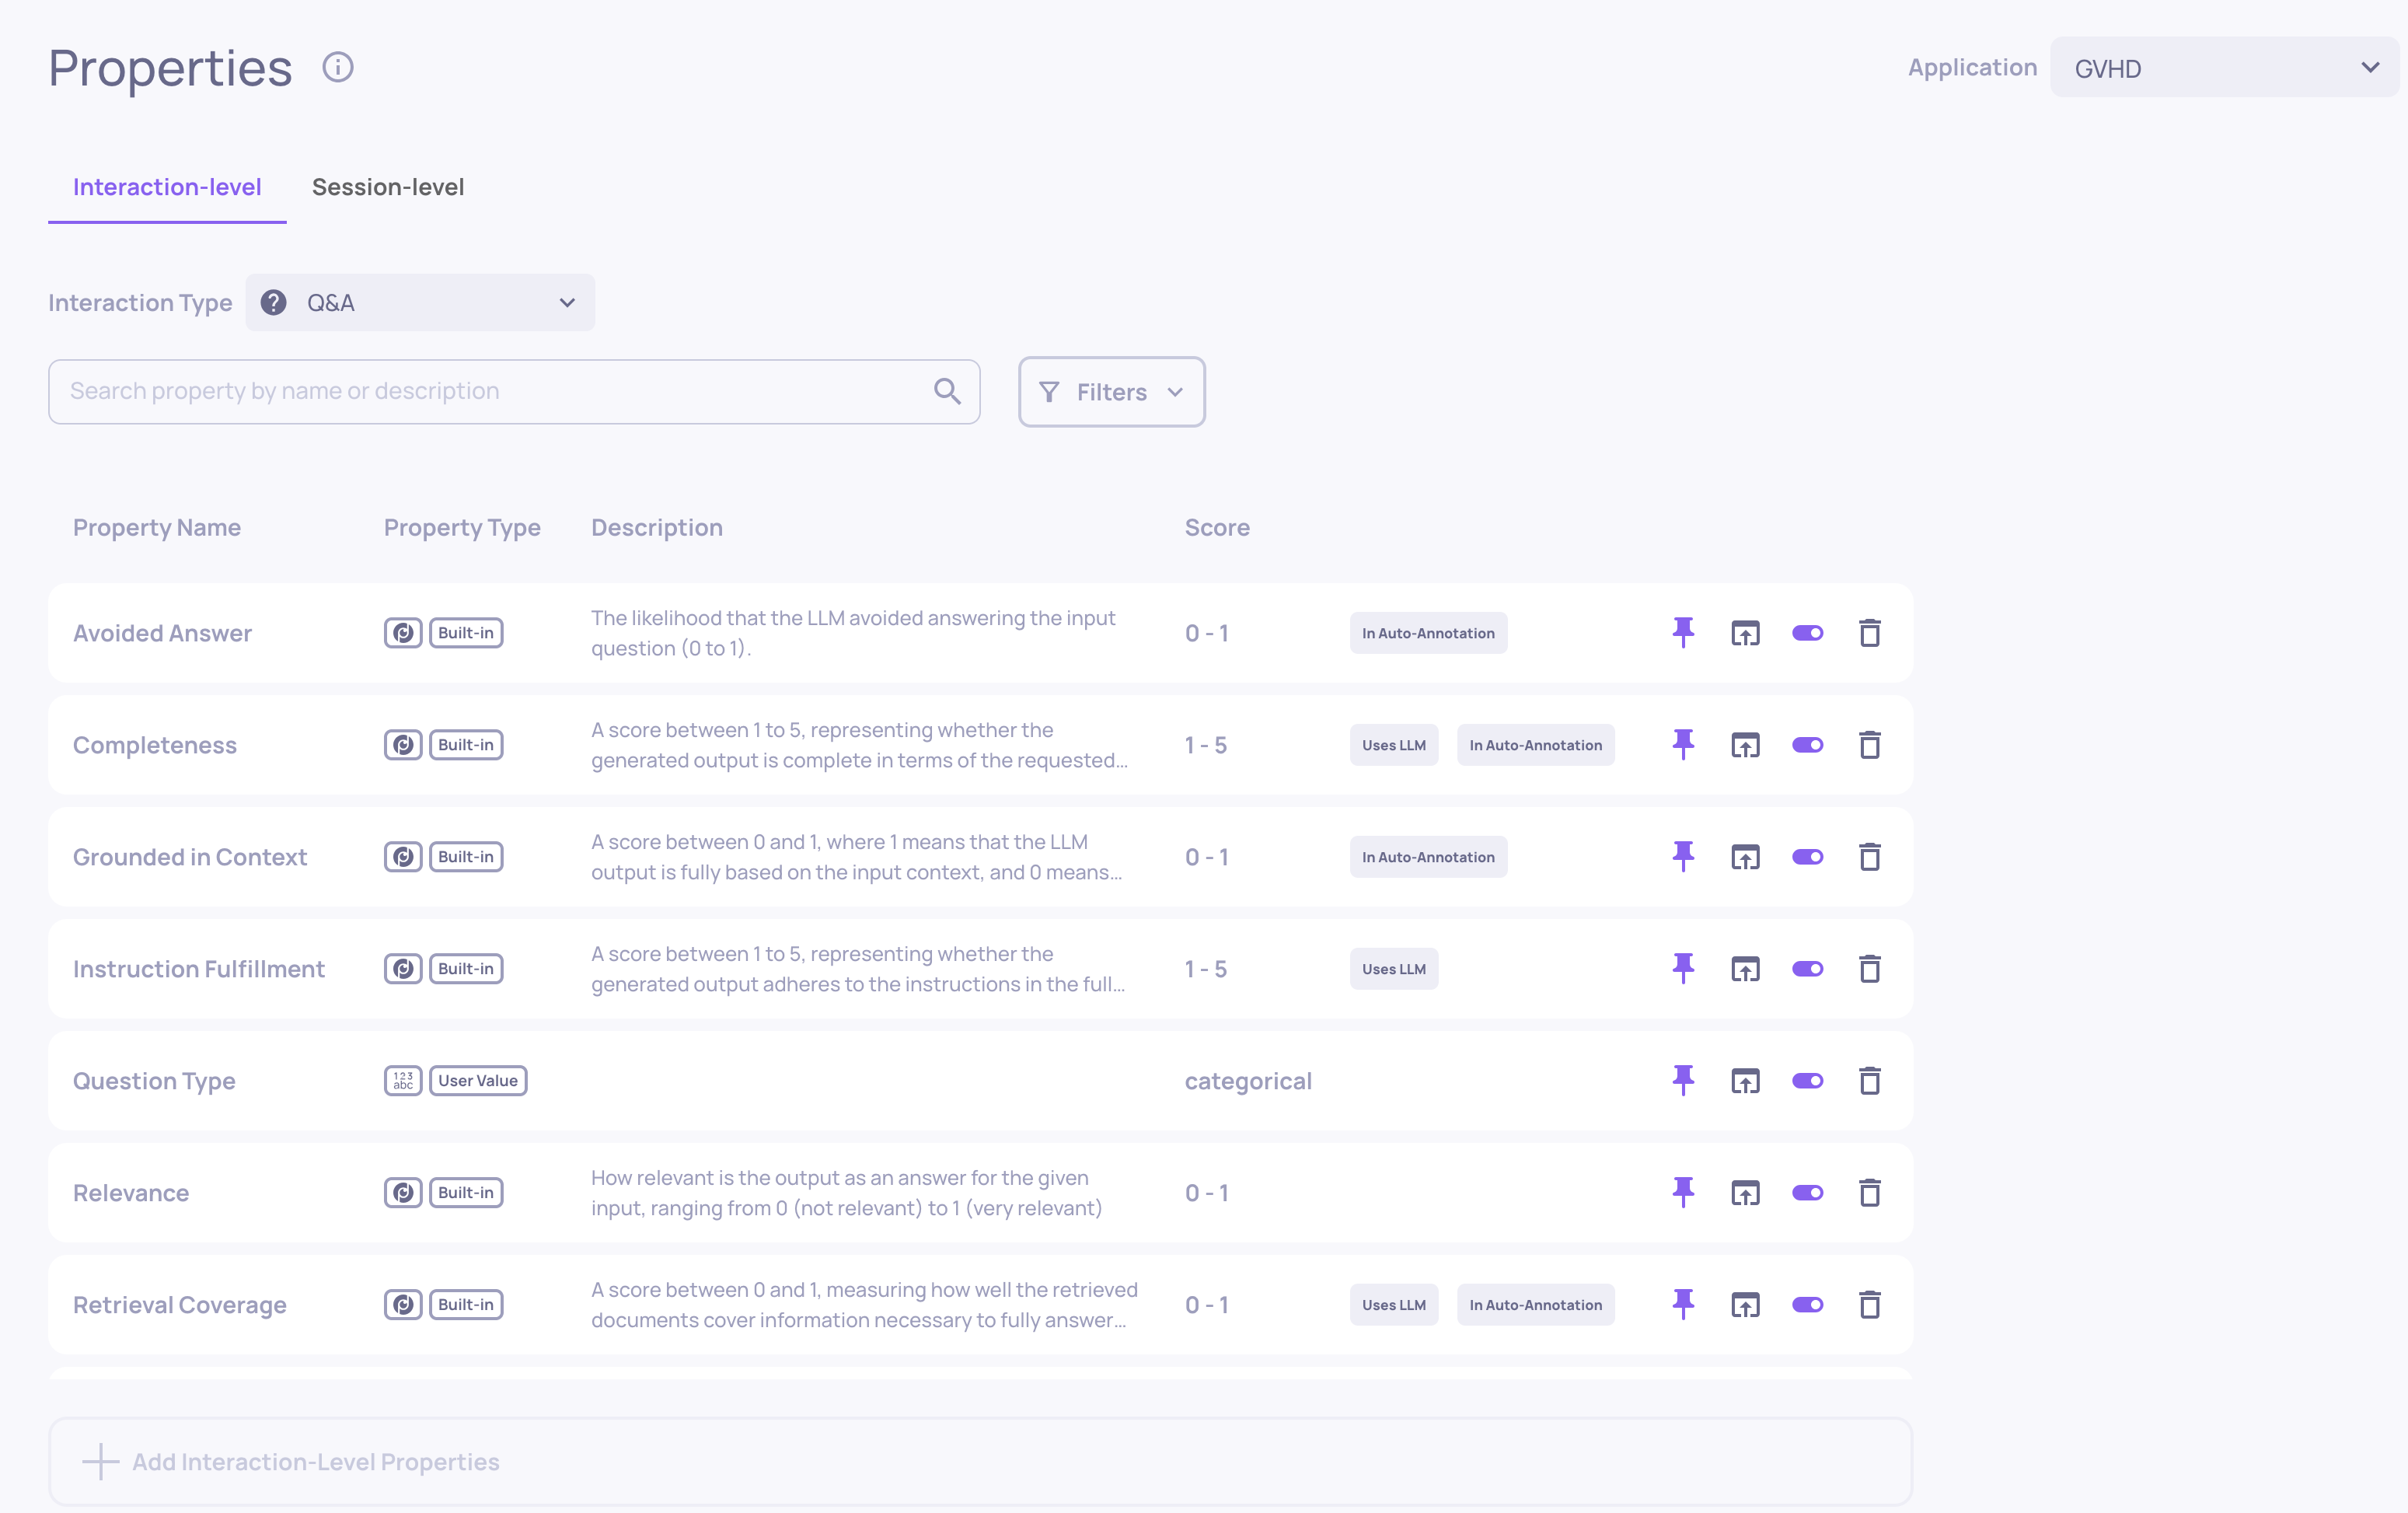
Properties
Where: Left sidebar > Properties
Where you manage the properties configured for your application. Properties are configured per interaction type. From here you can:
-
Enable or disable built-in properties
-
Create and edit prompt properties (custom LLM-based evaluators)
-
Manage user-value properties (metrics you calculate yourself)
-
Configure session-level properties
-
Pause or reactivate property calculations
-
Recalculate property scores after changing configuration
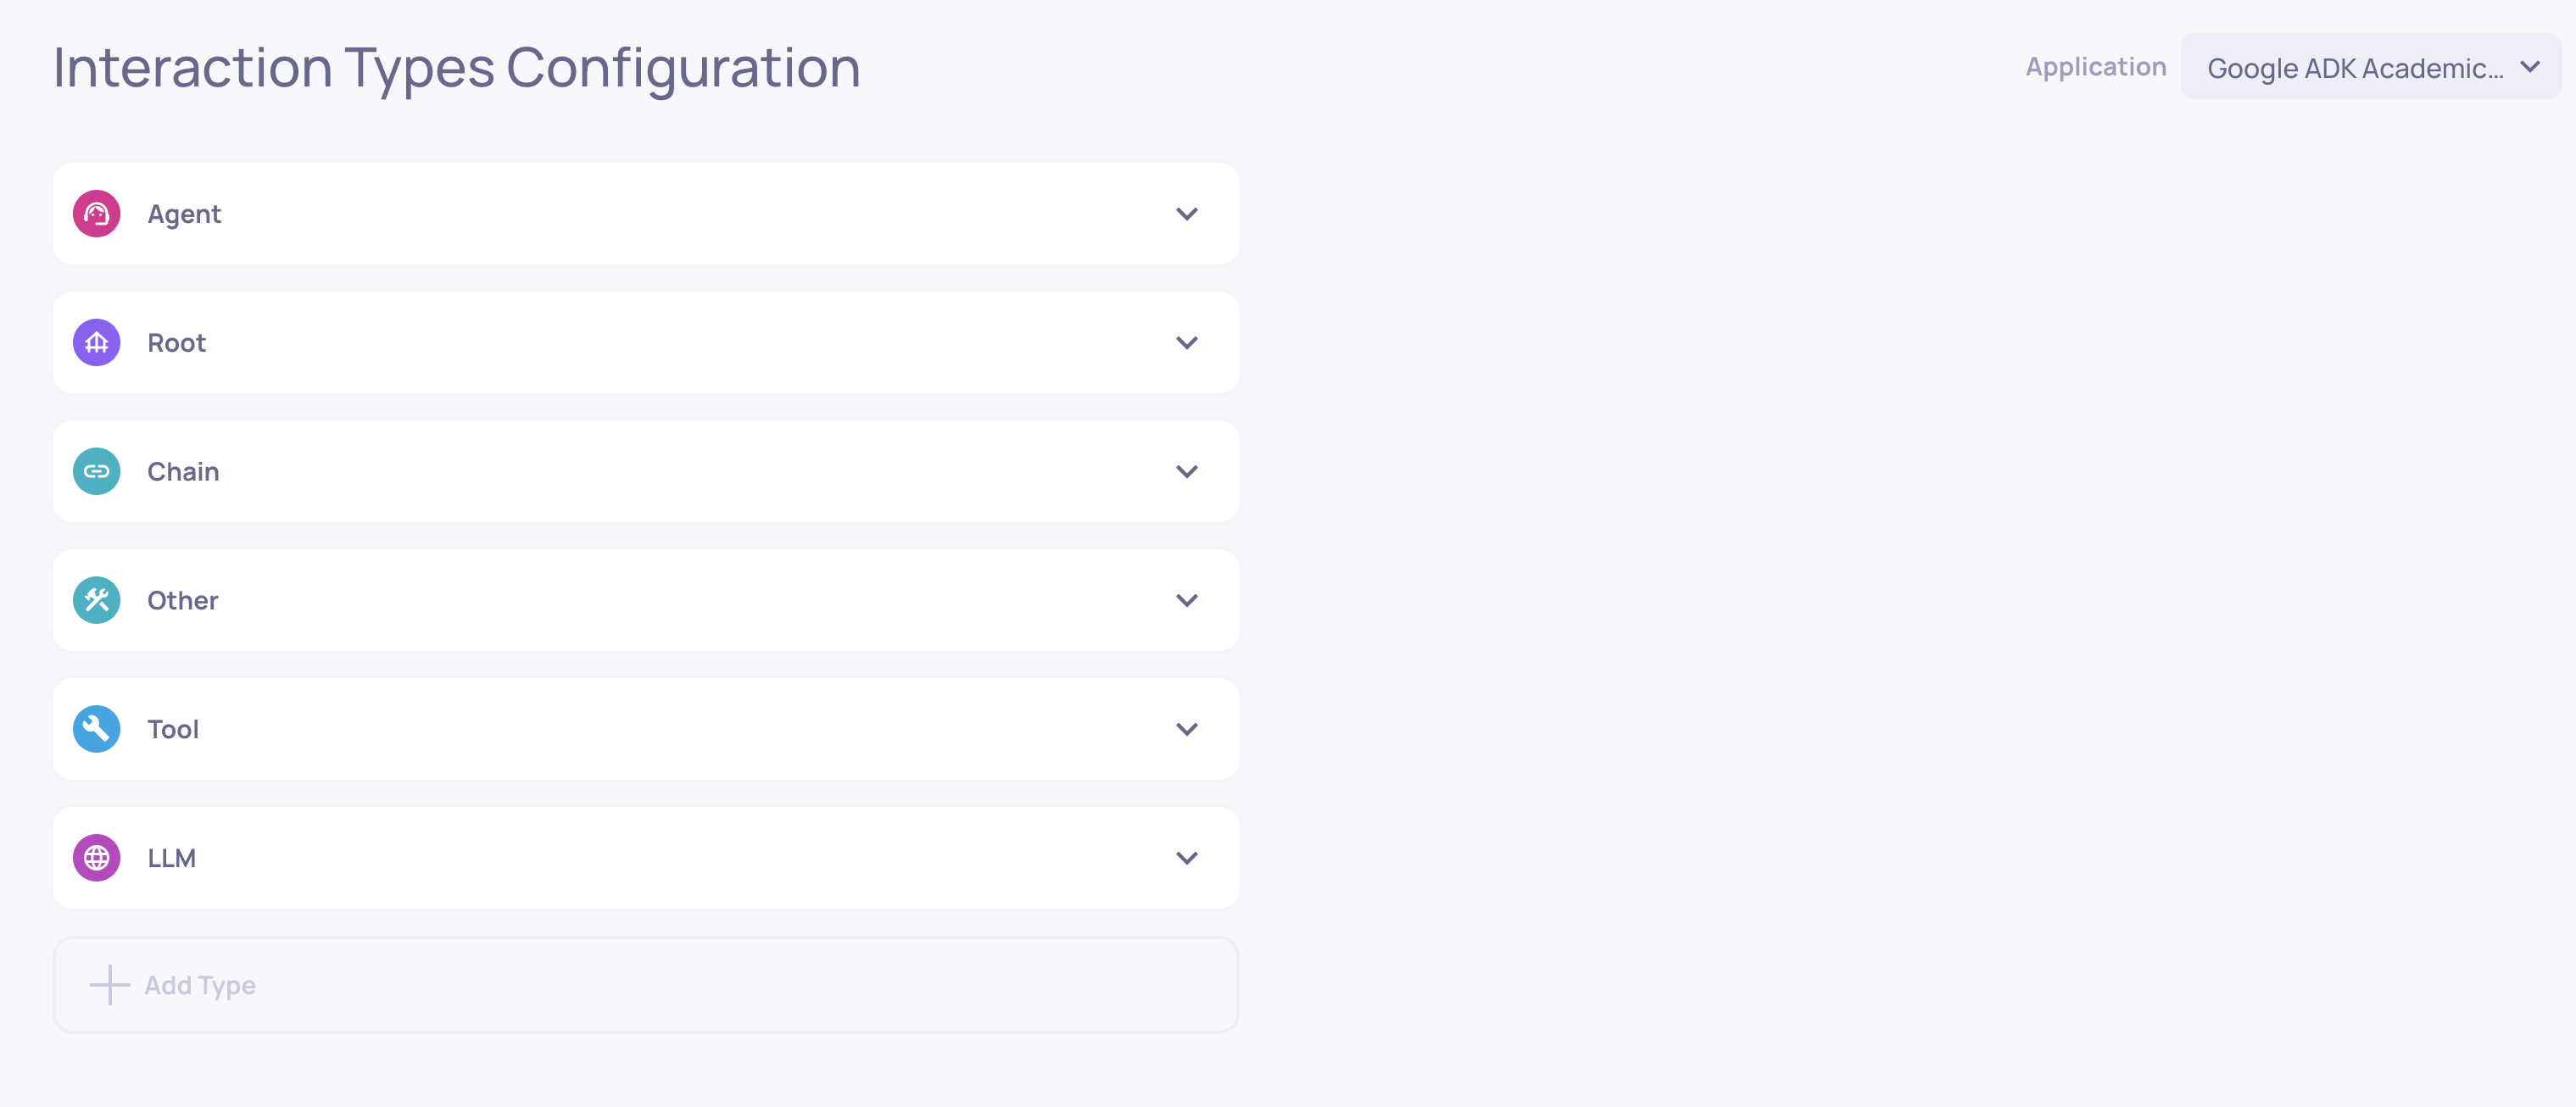
Interaction Types
Where: Left sidebar > Interaction Types
Where you manage how Deepchecks categorizes interactions. From here you can:
- View which interaction types are active in the application
- Map specific span names to custom interaction types
- Access the auto-annotation editor for each type
- Download or upload the configuration YAML
Each interaction type has its own independent set of properties and annotation rules.
Organization-Level Screens
These screens manage workspace-wide settings that apply across all applications.
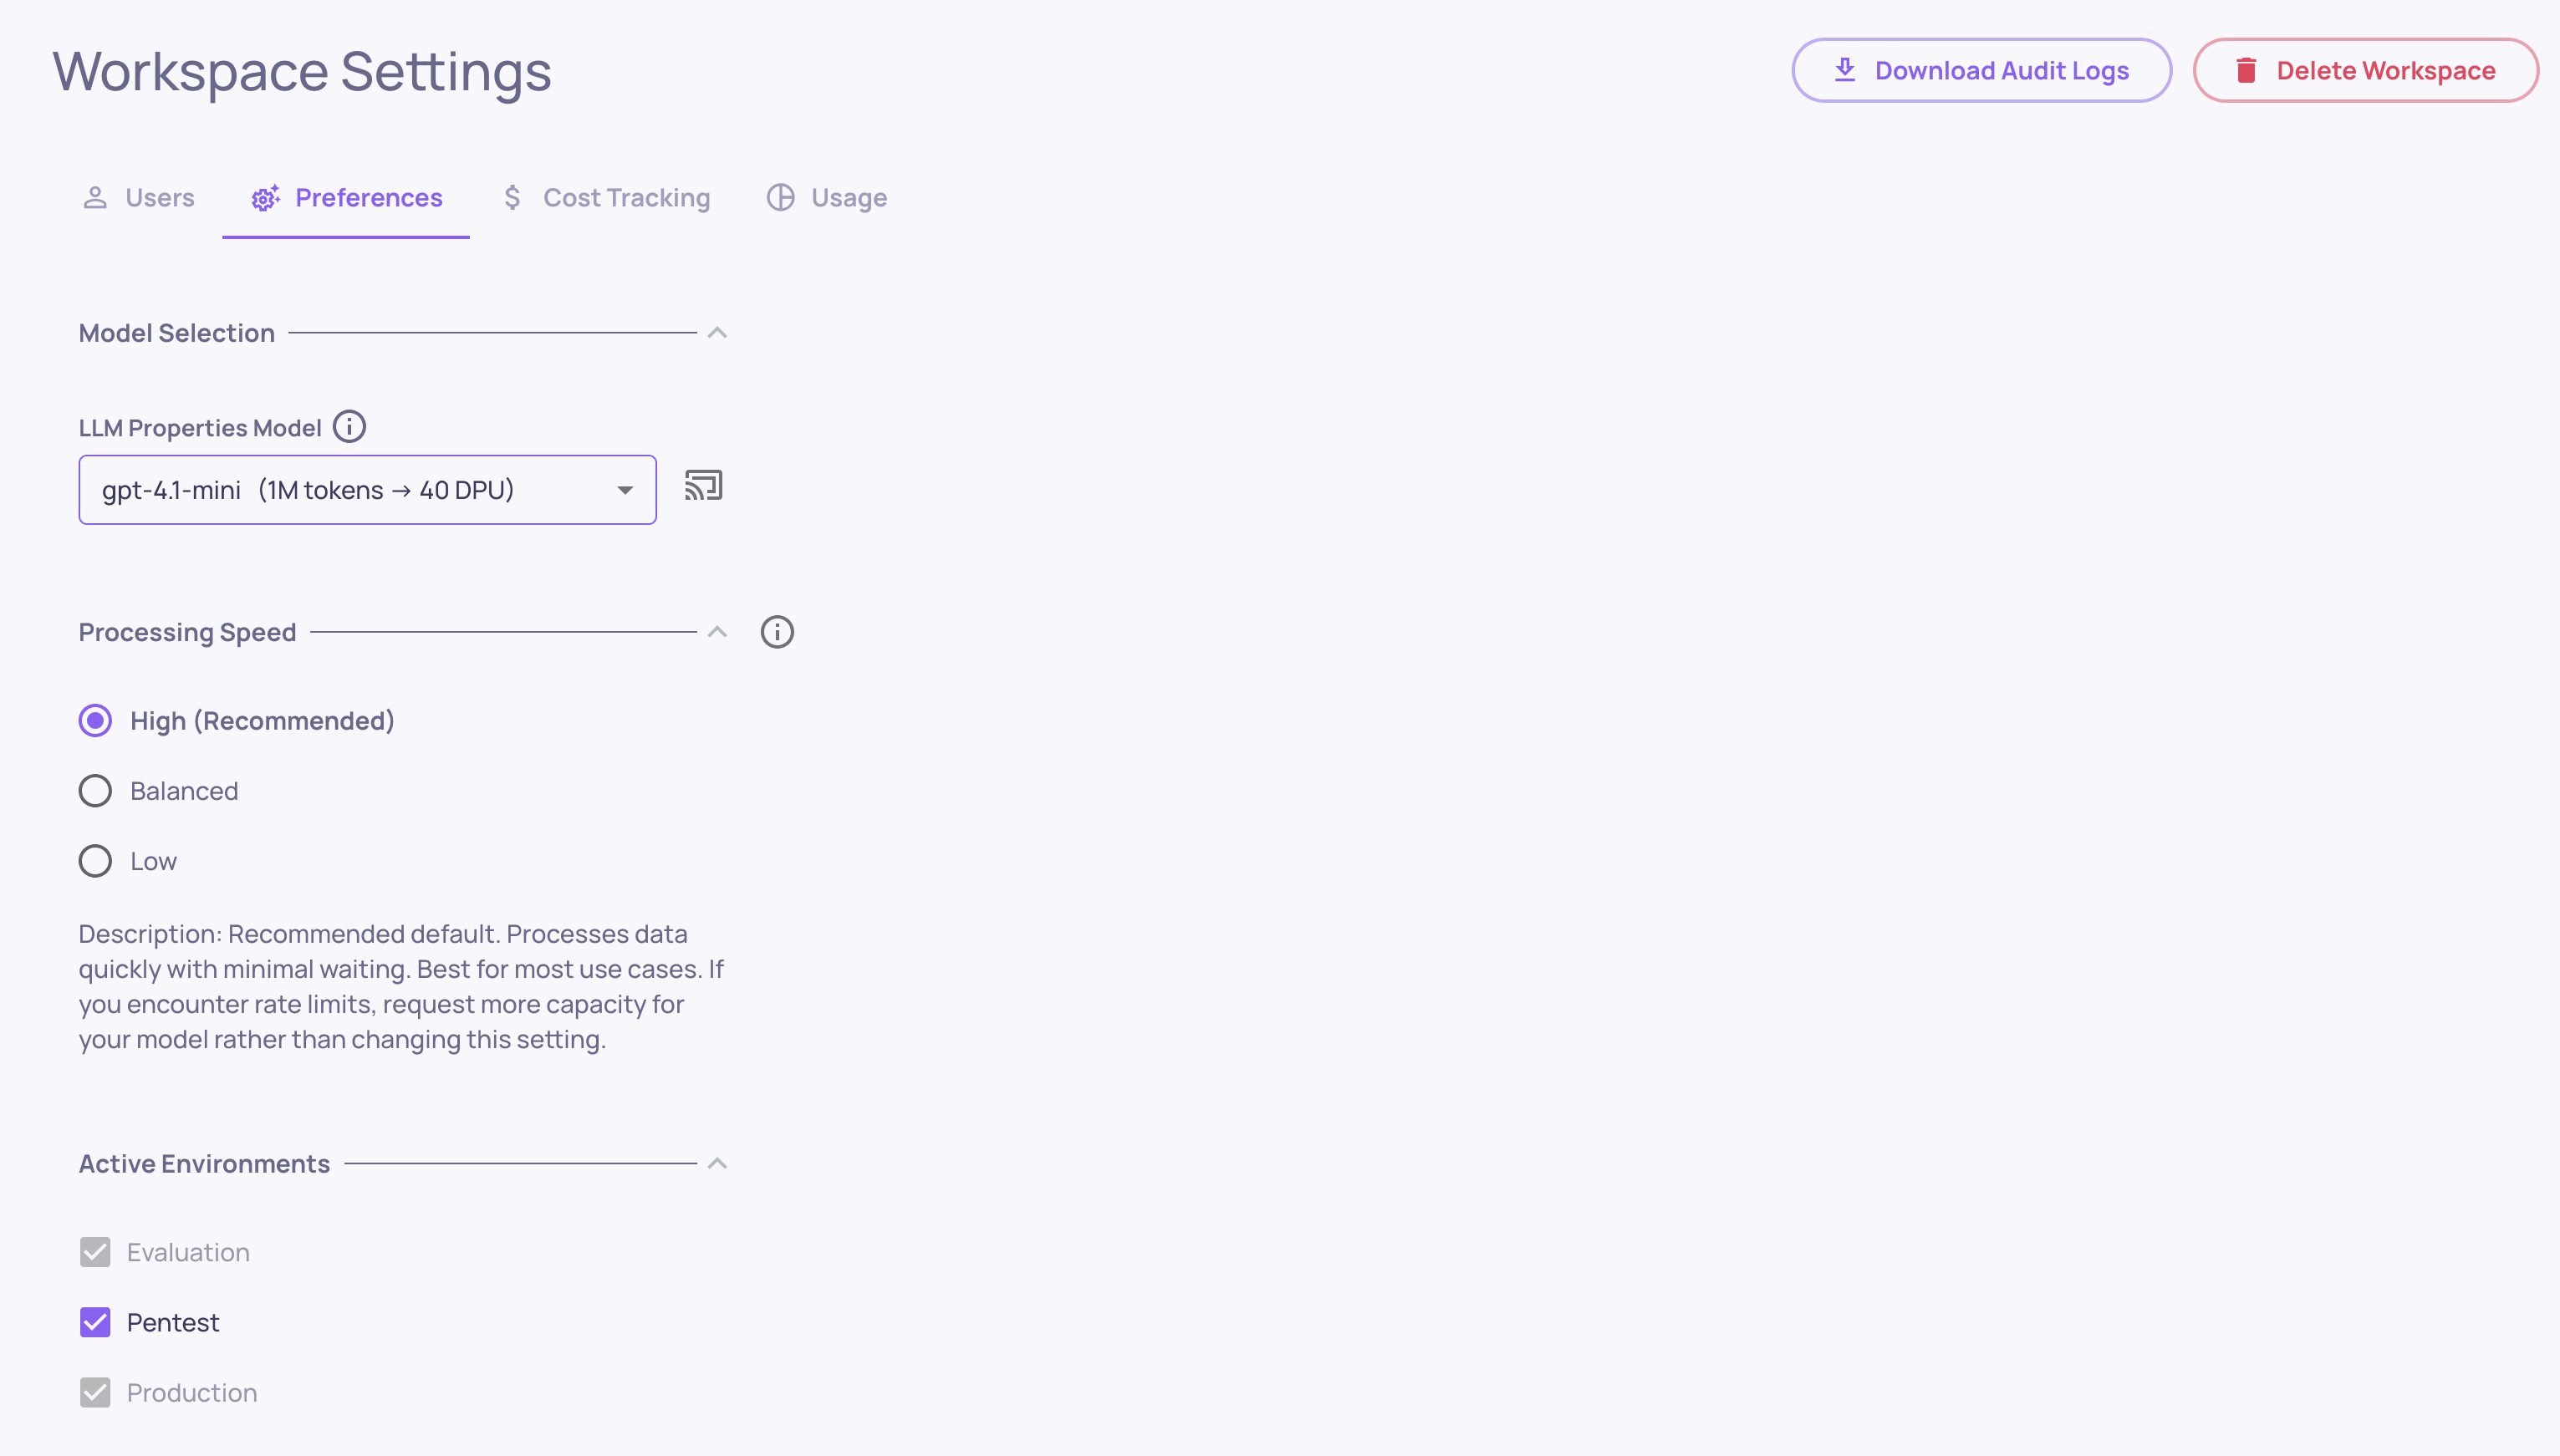
Workspace Settings
Where: Bottom-left > Workspace Settings
Organization-level configuration with the following tabs:
-
Usage - DPU consumption broken down by application, version, environment, service type, and model. Admins can download a detailed usage report as CSV.
-
Members - manage who has access to your workspace, invite new users, and assign roles (Owner, Admin, User)
-
API Keys - generate and manage API tokens for the SDK and integrations
-
Integrations - connect external monitoring tools (Datadog, New Relic, AWS CloudWatch) and configure LLM providers for property evaluation
-
Preferences - application-level defaults like translation/detection settings, topic classification, and the default model for new applications
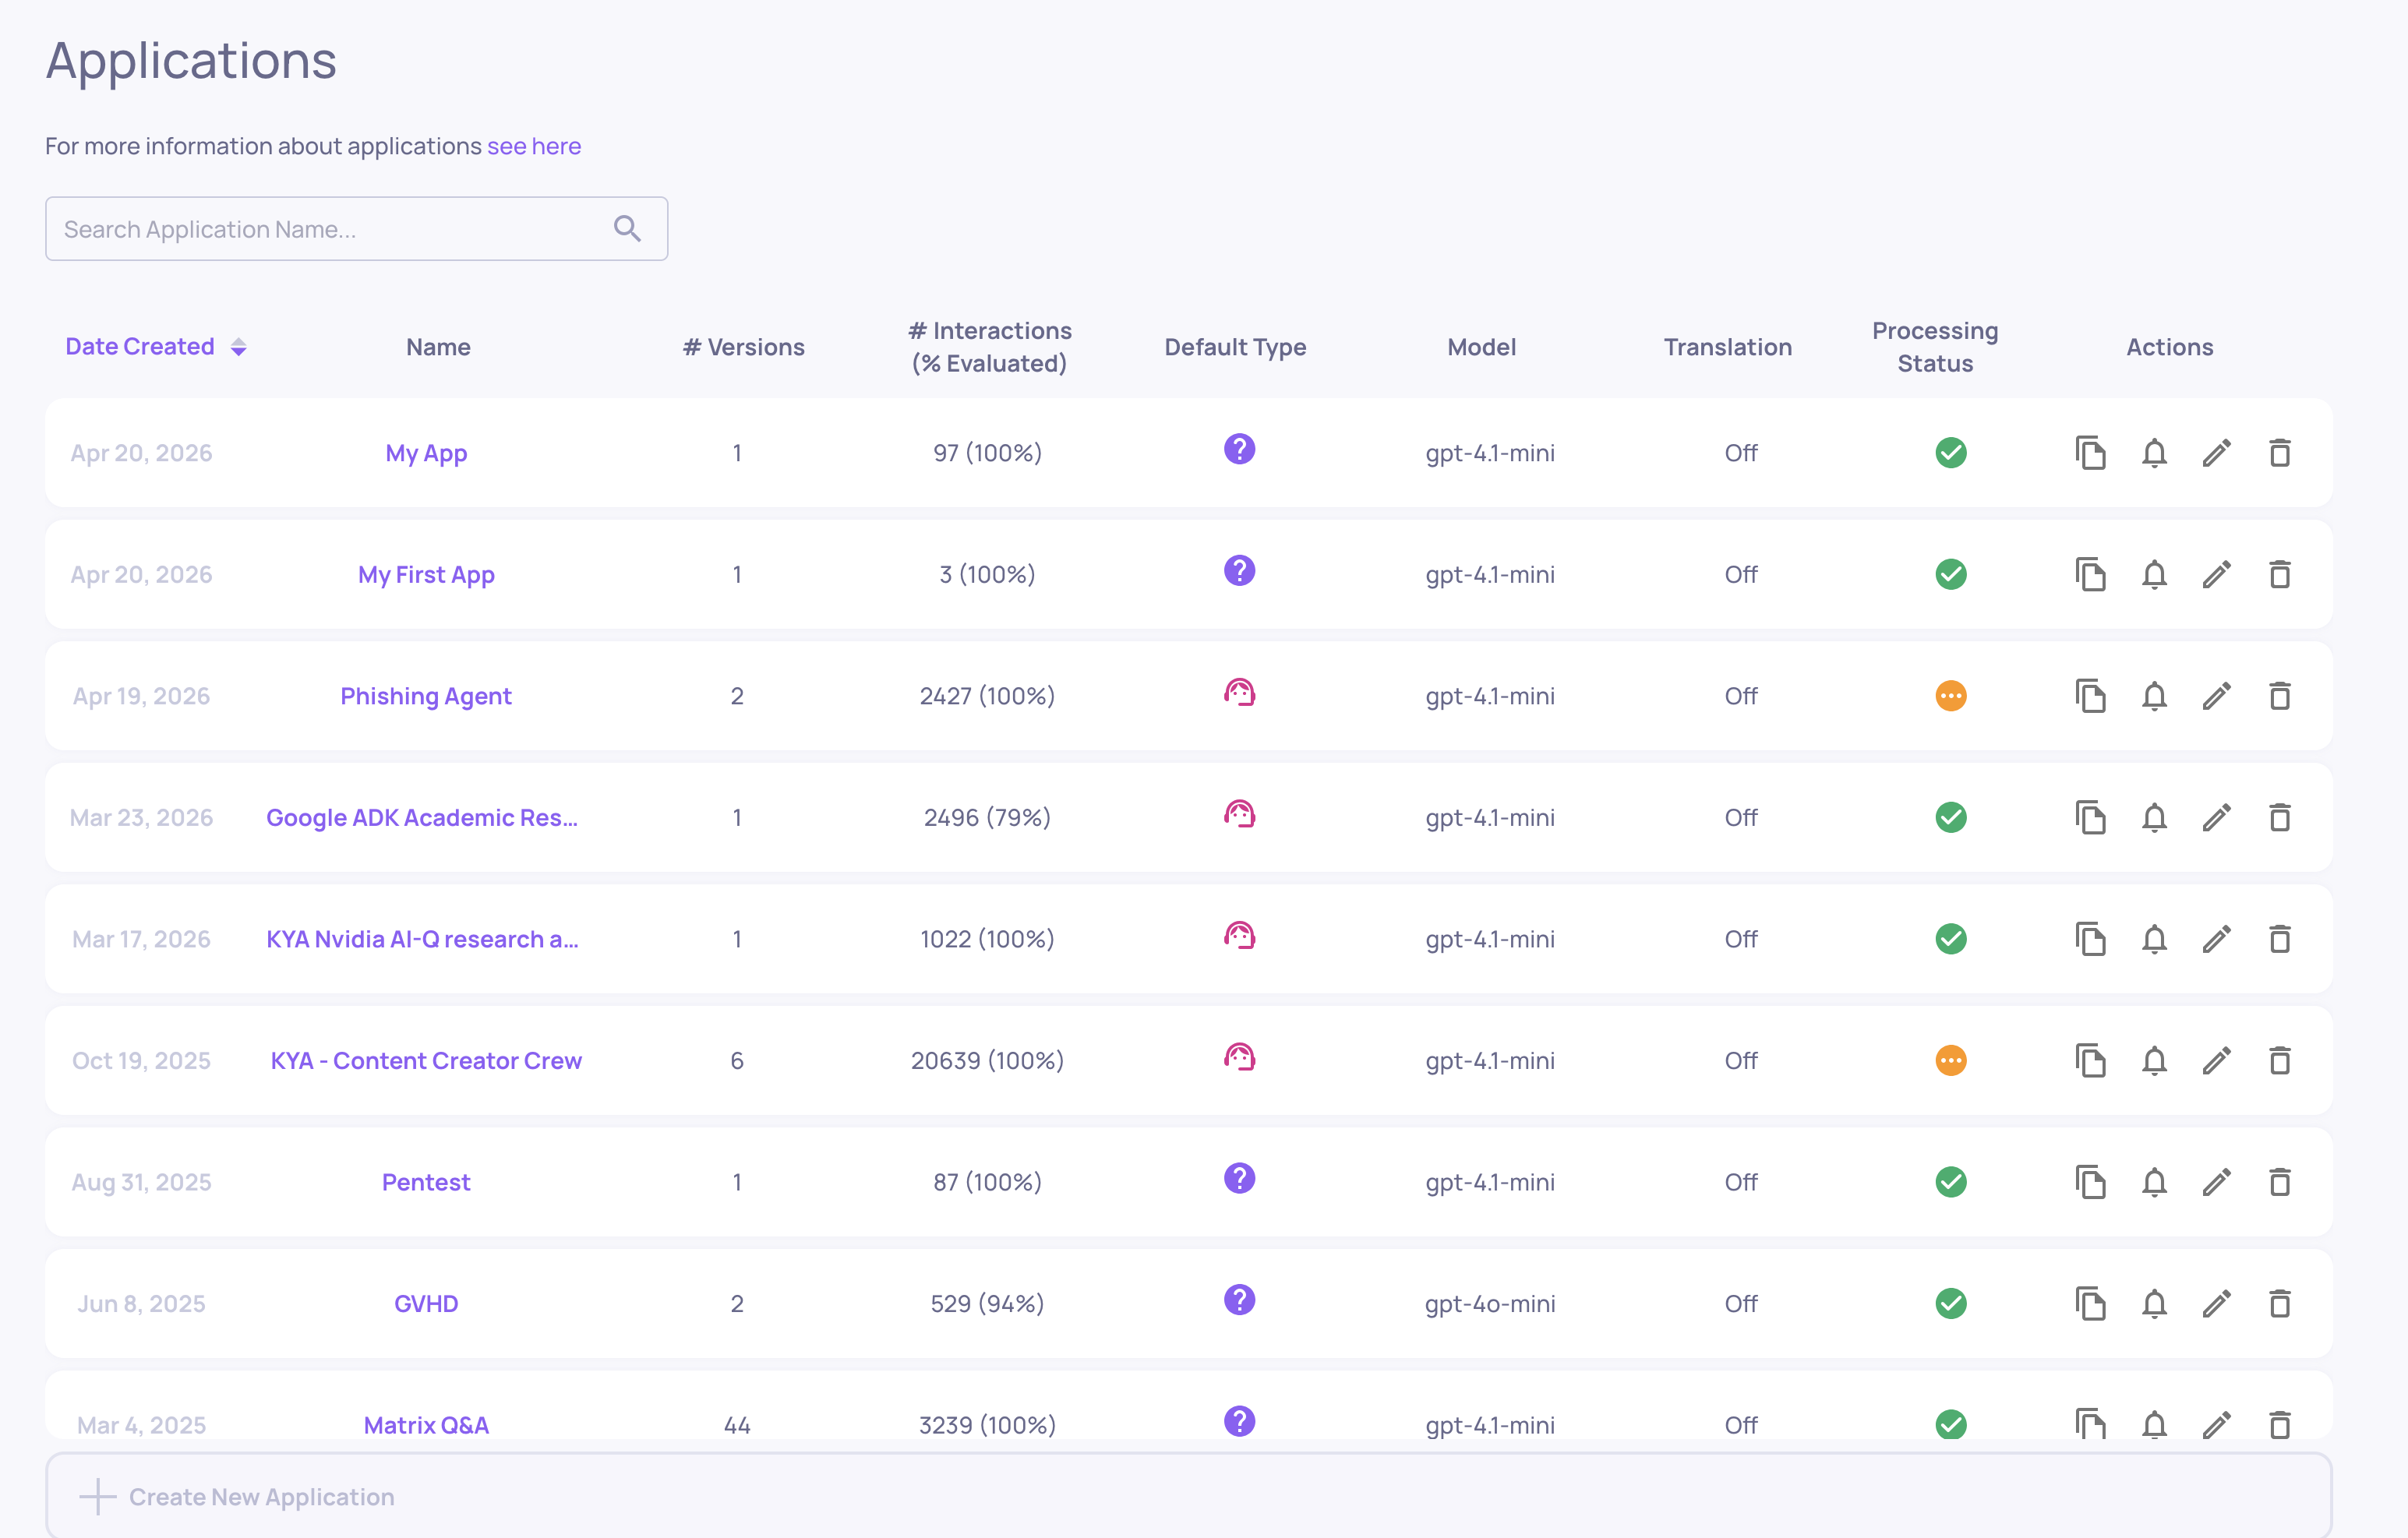
Manage Applications
Where: Bottom-left > Manage Applications
The home screen for your workspace. Shows all your applications - each one represents a distinct LLM task or product. From here you can:
-
Create a new application (set the name, type, and initial configuration)
-
Open an existing application to explore its versions
-
Edit application settings (sampling ratio, document classification, cost tracking, field mapping)
Updated 3 months ago