Navigating the Single Interaction/Session Screen
Walk through individual traces span by span - inspect data, evaluation results, and the execution hierarchy in one screen.
Root Cause Analysis tells you what is failing and why at the version level. But sometimes you need to look at a single trace in detail - walk through each span, see the exact inputs and outputs, and understand how evaluation scores were calculated. The Session View brings everything together in one screen.
The four sections of the Session View
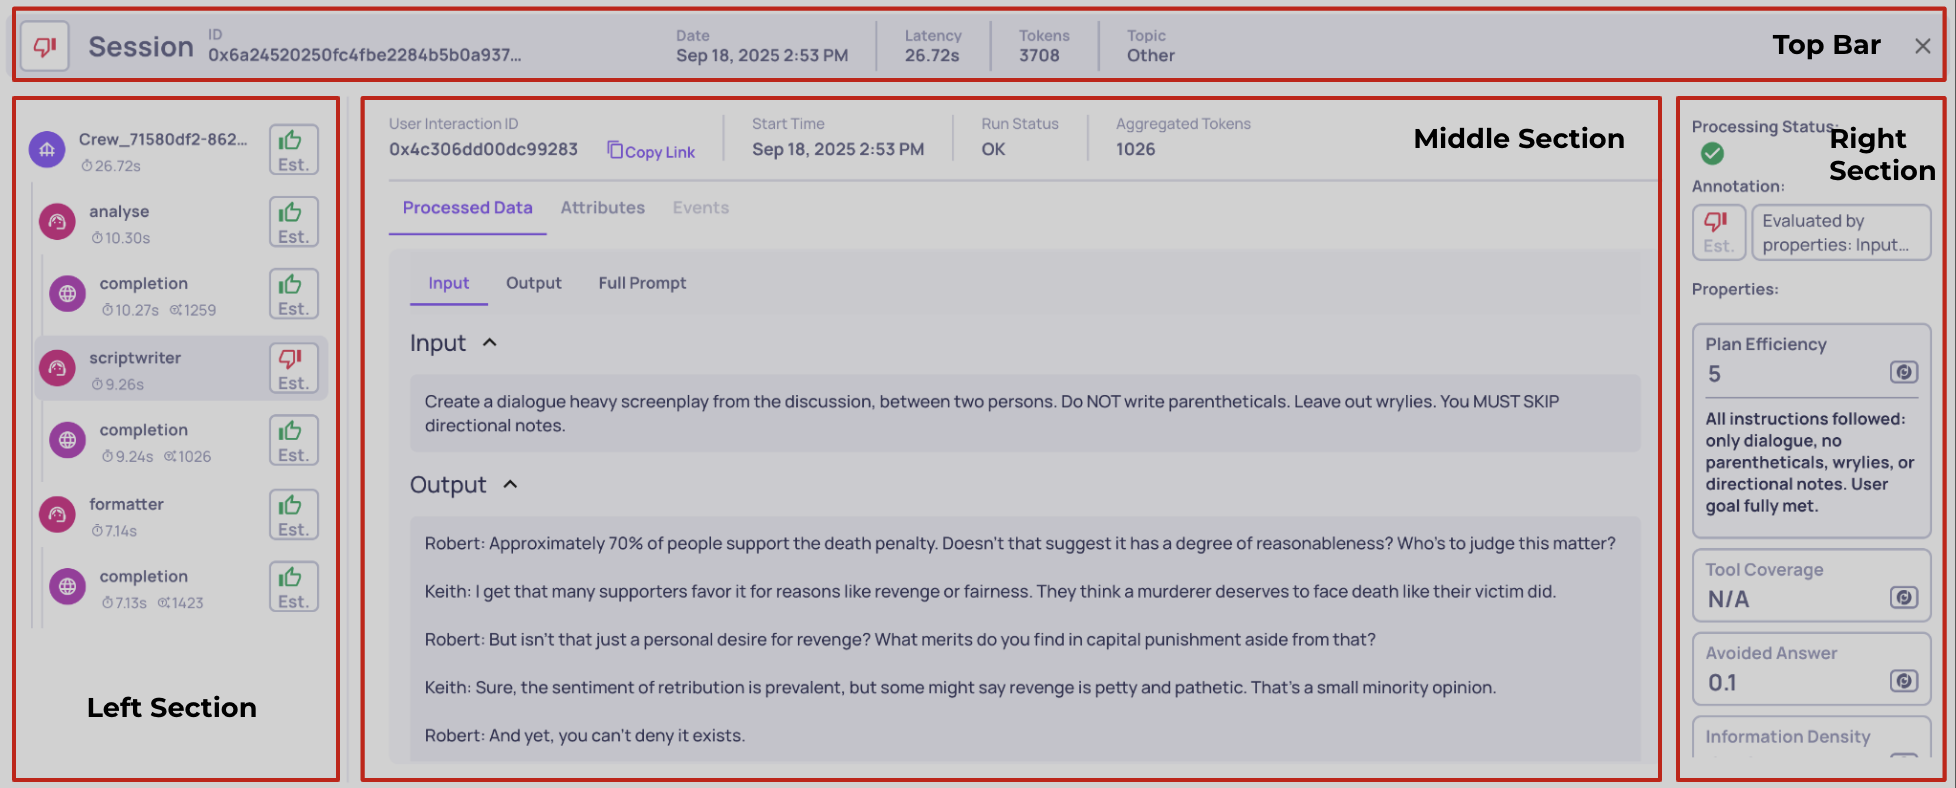
The screen is divided into four areas, each with a specific role:
The four sections of the Session View
Left - Trace map. All spans in the trace, displayed as a tree. Click any span to select it and update the rest of the screen. This is your table of contents for the execution.
Middle - Span data. The raw data for the selected span: system metrics, data fields (input, output, full prompt, retrieval context), and logged attributes. This is what actually happened at that step.
Right - Evaluation results. What Deepchecks calculated for the selected span: property scores with reasoning, annotations (both automatic and manual), and processing status. This is how Deepchecks assessed that step.
Top bar - Session overview. Session or trace ID, aggregated latency and token usage, and the session topic. This gives you a high-level snapshot without drilling into individual spans.
Components explained
The annotated screenshot below shows every component in detail. Each number corresponds to a section below.
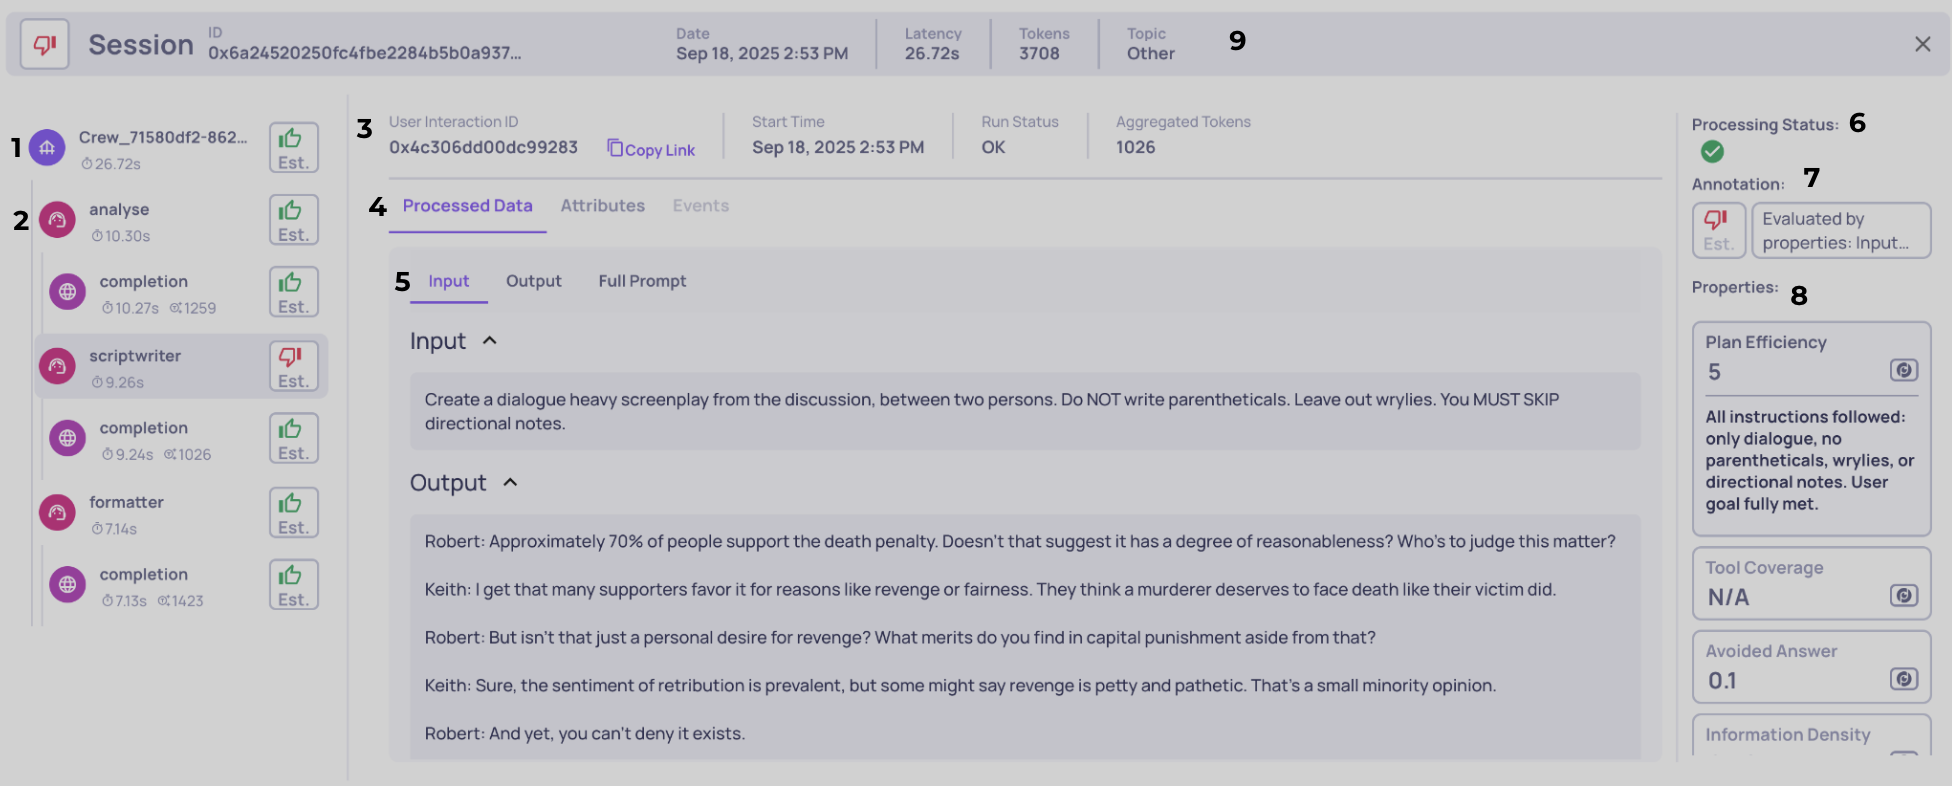
1 - Span tab
Selecting a span tab makes the middle and right sections show data for that span. Each tab displays the interaction type icon (Root, Agent, LLM, Tool), measured latency, token usage, and the span's annotation. Hover for additional metadata like timestamps and span ID.
2 - Span hierarchy
The left column shows parent-child relationships with indentation and connector lines. This hierarchy matters for three reasons:
- Navigation - quickly find where a specific action happened in the trace
- Metric aggregation - rollups (total latency, aggregate token usage) are computed from the hierarchy
- Evaluation logic - many properties use parent-child relationships when computing scores (for example, agent-level properties that inspect their tool children)
3 - System metrics and metadata
When you select a span, the middle section shows its system data: span ID, start/end timestamps, run status (OK, ERROR, UNSET), and aggregated token counts with total, min, average, and max statistics. For parent spans, aggregated tokens include all descendants. You can copy a direct link to share the exact span with teammates.
4 - Data source selector
Not all data comes from the same place. Toggle between three views:
- Processed Data (default) - Structured fields that Deepchecks uses for evaluation (input, output, prompt, retrieval chunks)
- Attributes - Raw span attributes in JSON format
- Events - Logged events in JSON format
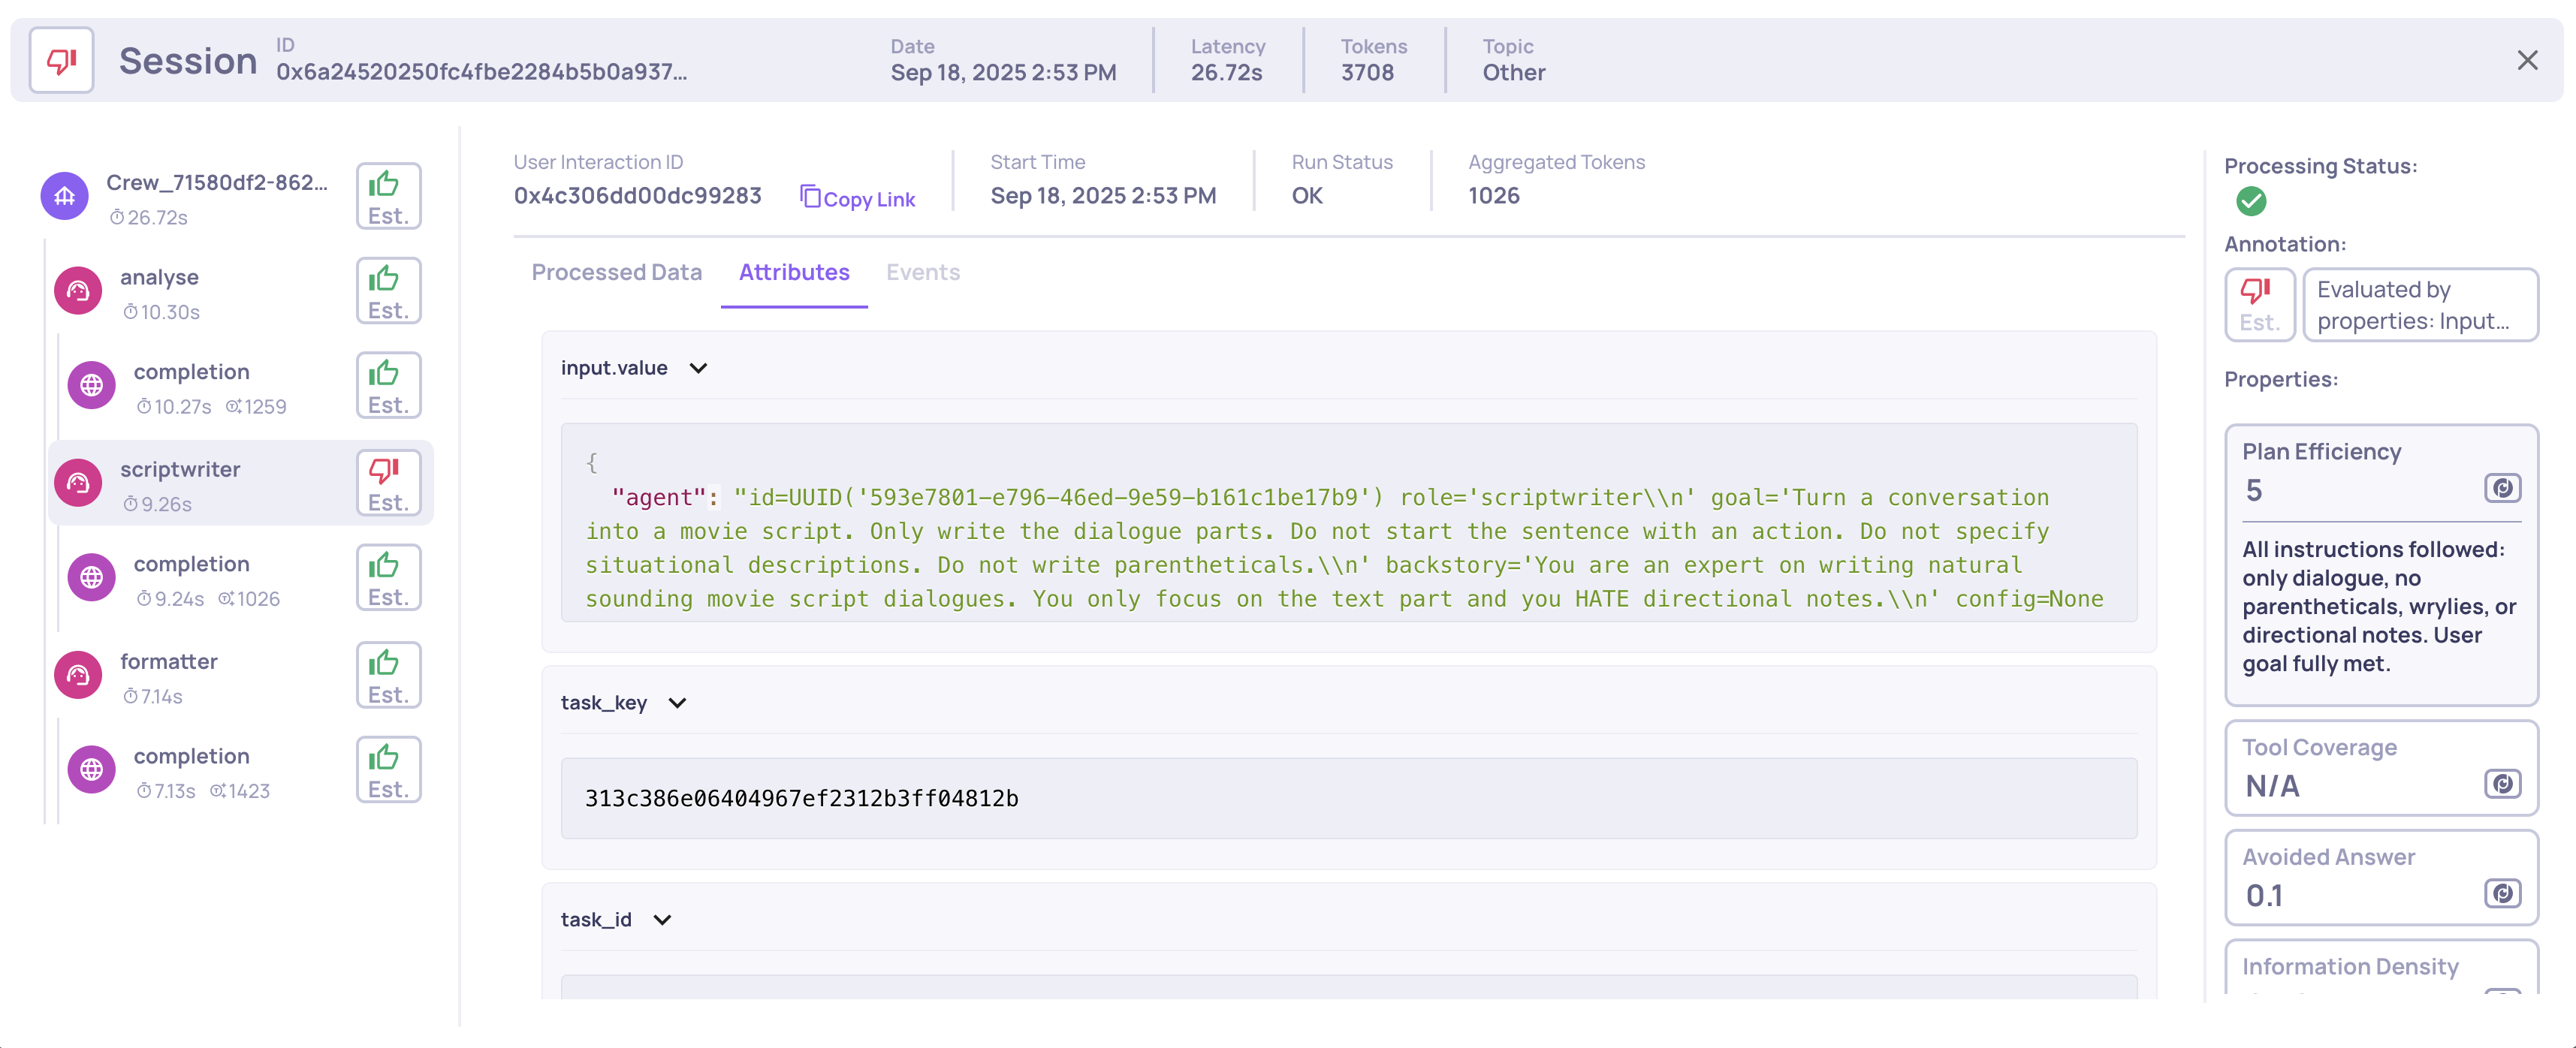
Viewing raw span attributes
5 - Data field navigation
Processed data is organized into fields (Input, Output, Full Prompt, Retrieval Context, etc.). This bar lets you expand or collapse individual fields to focus on what matters. These are the same fields that Deepchecks uses as inputs when calculating properties - what you see here directly drives the scores in the right panel.
6 - Processing status
Shows whether Deepchecks has finished evaluating this span:
- Completed - All analysis steps are complete. Scores and annotations are final.
- In Progress - Some analysis steps (property calculations, annotations, topic inference, similarity checks) are still running. Values may update.
- Partial - One or more analysis steps failed or became stuck. Re-upload the interaction to retry.
The same status appears on each row of the Interactions and Sessions lists. A session's status aggregates its interactions - "Partial" if any is partial, "Completed" when all are completed, otherwise "In Progress".
7 - Annotations
Shows the annotation for the selected interaction - both the automatic label and any human label applied. When a human annotation exists, it takes precedence and is shown first.
As a human annotator, you can:
- Label the interaction as Good, Bad, or Unknown
- Add a free-text note to explain your reasoning or flag something for review
Human annotations feed into the Deepchecks Evaluator - the more interactions you annotate, the more accurate the automatic annotation pipeline becomes.
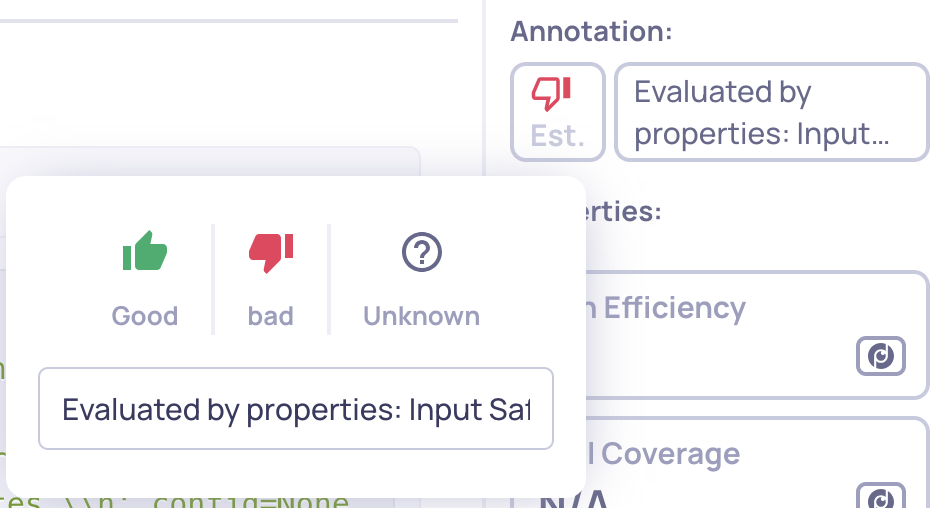
Click the annotation to add or edit a human label
8 - Property list
All properties active for the selected span's interaction type. Properties are grouped into Pinned (starred to your Overview) and Other, with scored properties shown first and N/A values at the end. Each entry shows the property name, type (built-in, prompt, or user-value), and score. Click to expand the full reasoning.
Even null scores include reasoning explaining why
9 - Session bar
The top bar provides the session-level summary: session ID (usually the trace ID), start timestamp, aggregated latency and tokens across all spans, and the session topic. This stays visible regardless of which span is selected.
The bar also shows a session X of Y or interaction X of Y counter, depending on how you arrived at this screen. Use the arrows to move between items without going back to the list:
- Session X of Y - when you navigated here from the Sessions list. The arrows move through sessions in the same filtered list.
- Interaction X of Y - when you navigated here from the Interactions list. The arrows move through interactions matching the filters you had applied.