Auto-Instrumentation (Frameworks)
If you use LangGraph, CrewAI, Google ADK, or LangChain, add a few lines of setup code and Deepchecks captures every trace, span, and metric automatically.
Auto-instrumentation means Deepchecks hooks into your framework's execution and captures everything automatically - you do not need to manually format or send data. You add a few lines of setup code, run your pipeline as usual, and Deepchecks captures:
- The full span hierarchy (agents, tools, LLM calls, retrieval steps)
- Input and output for every span
- Raw attributes emitted by your framework (model name, tool arguments, LLM parameters, etc.)
- System metrics - latency, token usage, cost, and run status
All of this is sent to Deepchecks, which parses the raw framework attributes and maps each span to the correct interaction type automatically - no manual data formatting needed.
Installation
All framework integrations use the same package with the otel extra:
pip install "deepchecks-llm-client[otel]"Setup by framework
Each framework has a dedicated integration class. The setup pattern is the same - call register_dc_exporter once before running your pipeline.
Before you start: Make sure you have already created an application in Deepchecks (via the UI or SDK) and have your API key ready.
Self-hosted / SageMaker users: Replace the
hostURL in the examples below with your own Deepchecks endpoint. SaaS users can usehttps://app.llm.deepchecks.com/.
Here is an example using LangGraph:
from deepchecks_llm_client.data_types import EnvType
from deepchecks_llm_client.otel import LanggraphIntegration

LanggraphIntegration().register_dc_exporter(
    host="https://app.llm.deepchecks.com/",
    api_key="your-api-key",
    app_name="Your App Name",
    version_name="v1",
    env_type=EnvType.EVAL,
    log_to_console=True,  # optional: also print spans to console
)
After this setup, run your pipeline as normal. All traces are exported to Deepchecks automatically.
Each framework has its own integration class (CrewaiIntegration, GoogleAdkIntegration, LanggraphIntegration) - the setup pattern is identical. For full examples and framework-specific configuration, see the per-framework pages:
- LangGraph Integration - full example, subgraph patterns, naming conventions
- CrewAI Integration - full example with multi-agent research workflow
- Google ADK Integration - full example with weather agent, graph visualization setup
Grouping traces into sessions
By default, each trace is its own session. If your application has multi-turn conversations or multi-step workflows where multiple traces belong to the same user session, use the using_session context manager to group them:
from openinference.instrumentation import using_session

with using_session(session_id="user-session-123"):
    # All traces within this block share the same session ID
    result = crew_instance.kickoff(inputs={"query": "How do I reset my password?"})
This works with CrewAI, LangGraph, and Google ADK integrations.
Adding tags to traces
Tags let you categorize traces for filtering and analysis. For example, you might tag traces by feature area, customer segment, or test scenario:
from openinference.instrumentation import using_tags

with using_tags(tags=["billing", "enterprise-customer"]):
    result = crew_instance.kickoff(inputs={"query": "What are my billing options?"})
Tags appear in the Deepchecks UI alongside each interaction and can be used for filtering and root cause analysis.
Offline trace export
If you cannot send traces to Deepchecks in real time, see Offline Trace Export for how to export traces to a JSON file and upload them in a separate step.
What happens after upload
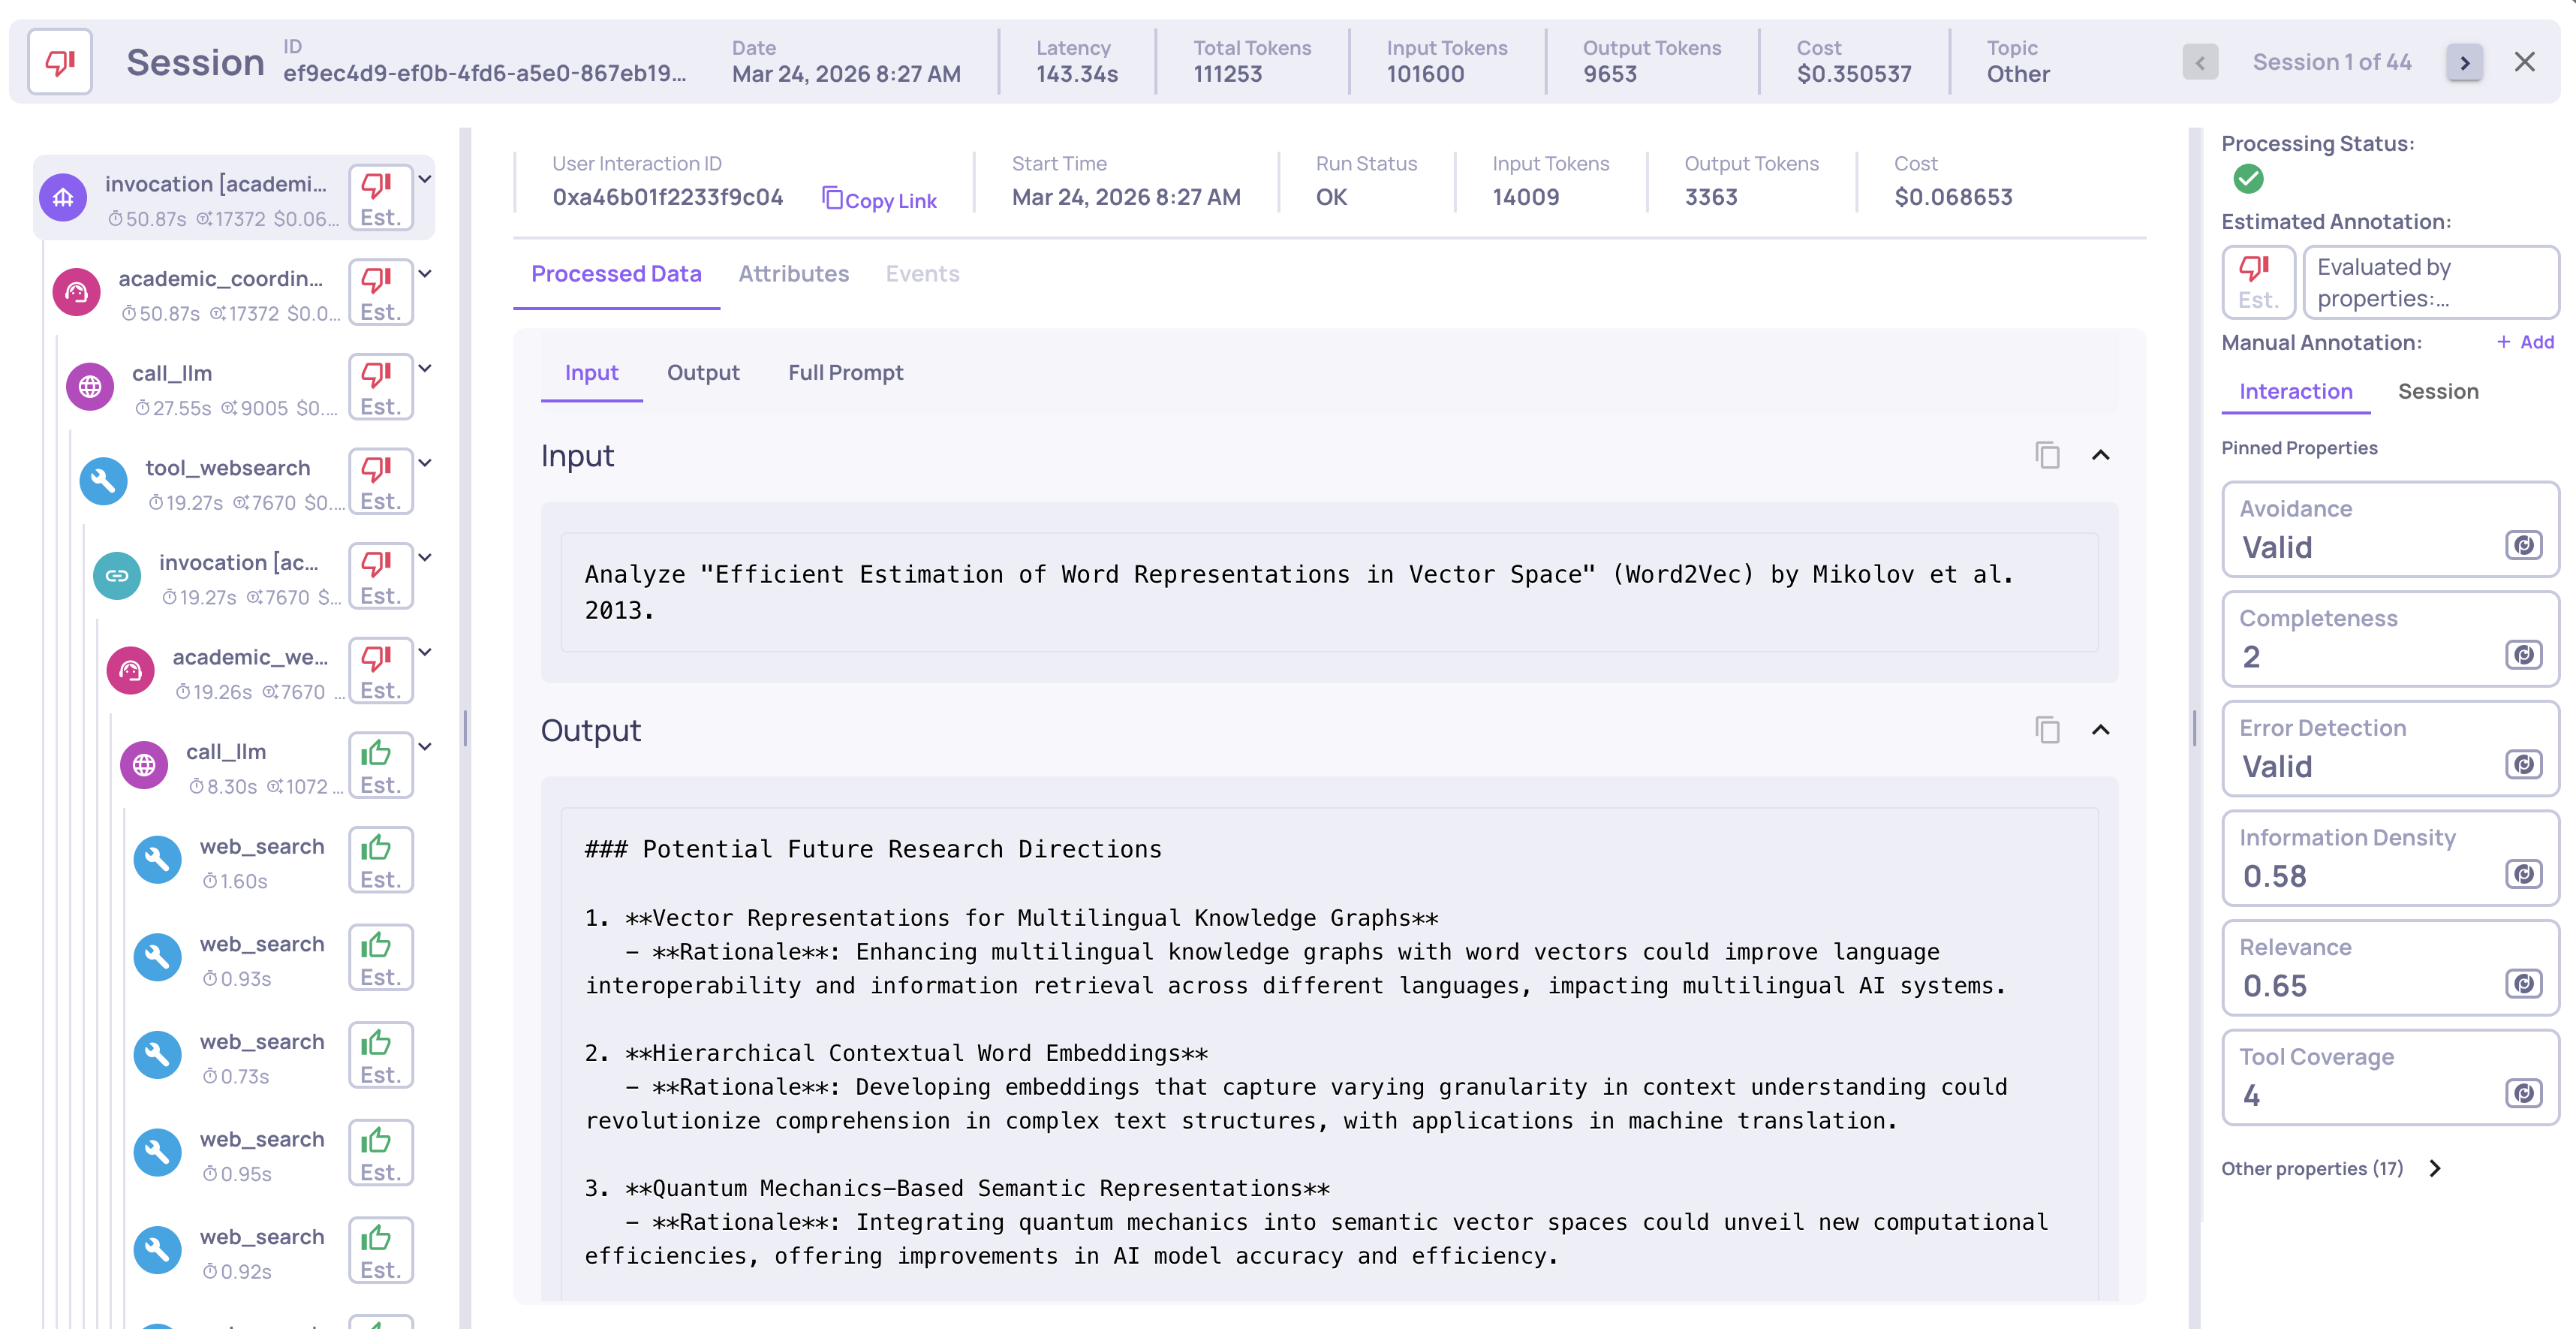
Once traces arrive in Deepchecks, the platform automatically:
-
Parses raw framework attributes into structured fields - model names, tool arguments, LLM parameters, and other data emitted by your framework are extracted from span attributes and mapped to the fields used for evaluation and filtering.
-
Maps each span to the correct interaction type (Root, Agent, Chain, Tool, LLM, Retrieval) - based on Deepchecks' research and parsing logic for each framework.
-
Computes system metrics - latency, token usage, and cost per span, aggregated up to the session level.
-
Groups spans into the trace hierarchy so you can inspect the full execution in the Sessions view.
-
Calculates properties on every interaction - quality scores like Plan Efficiency, Tool Completeness, Reasoning Integrity.
-
Runs the automatic annotation pipeline to assign Good/Bad/Unknown labels.
Updated 3 months ago