The Interactions and Sessions Screens
How to navigate, filter, and search the Interactions and Sessions screens - the starting point for any quality investigation in Deepchecks.
The Interactions screen and Sessions screen are where you go to find, filter, and inspect your data. Before running root cause analysis or debugging a specific failure, you'll typically come here to narrow down the set of interactions you want to investigate.
The Interactions Screen
The Interactions screen lists every individual interaction Deepchecks has evaluated - each row is one turn: a question, a tool call, an LLM response, etc.
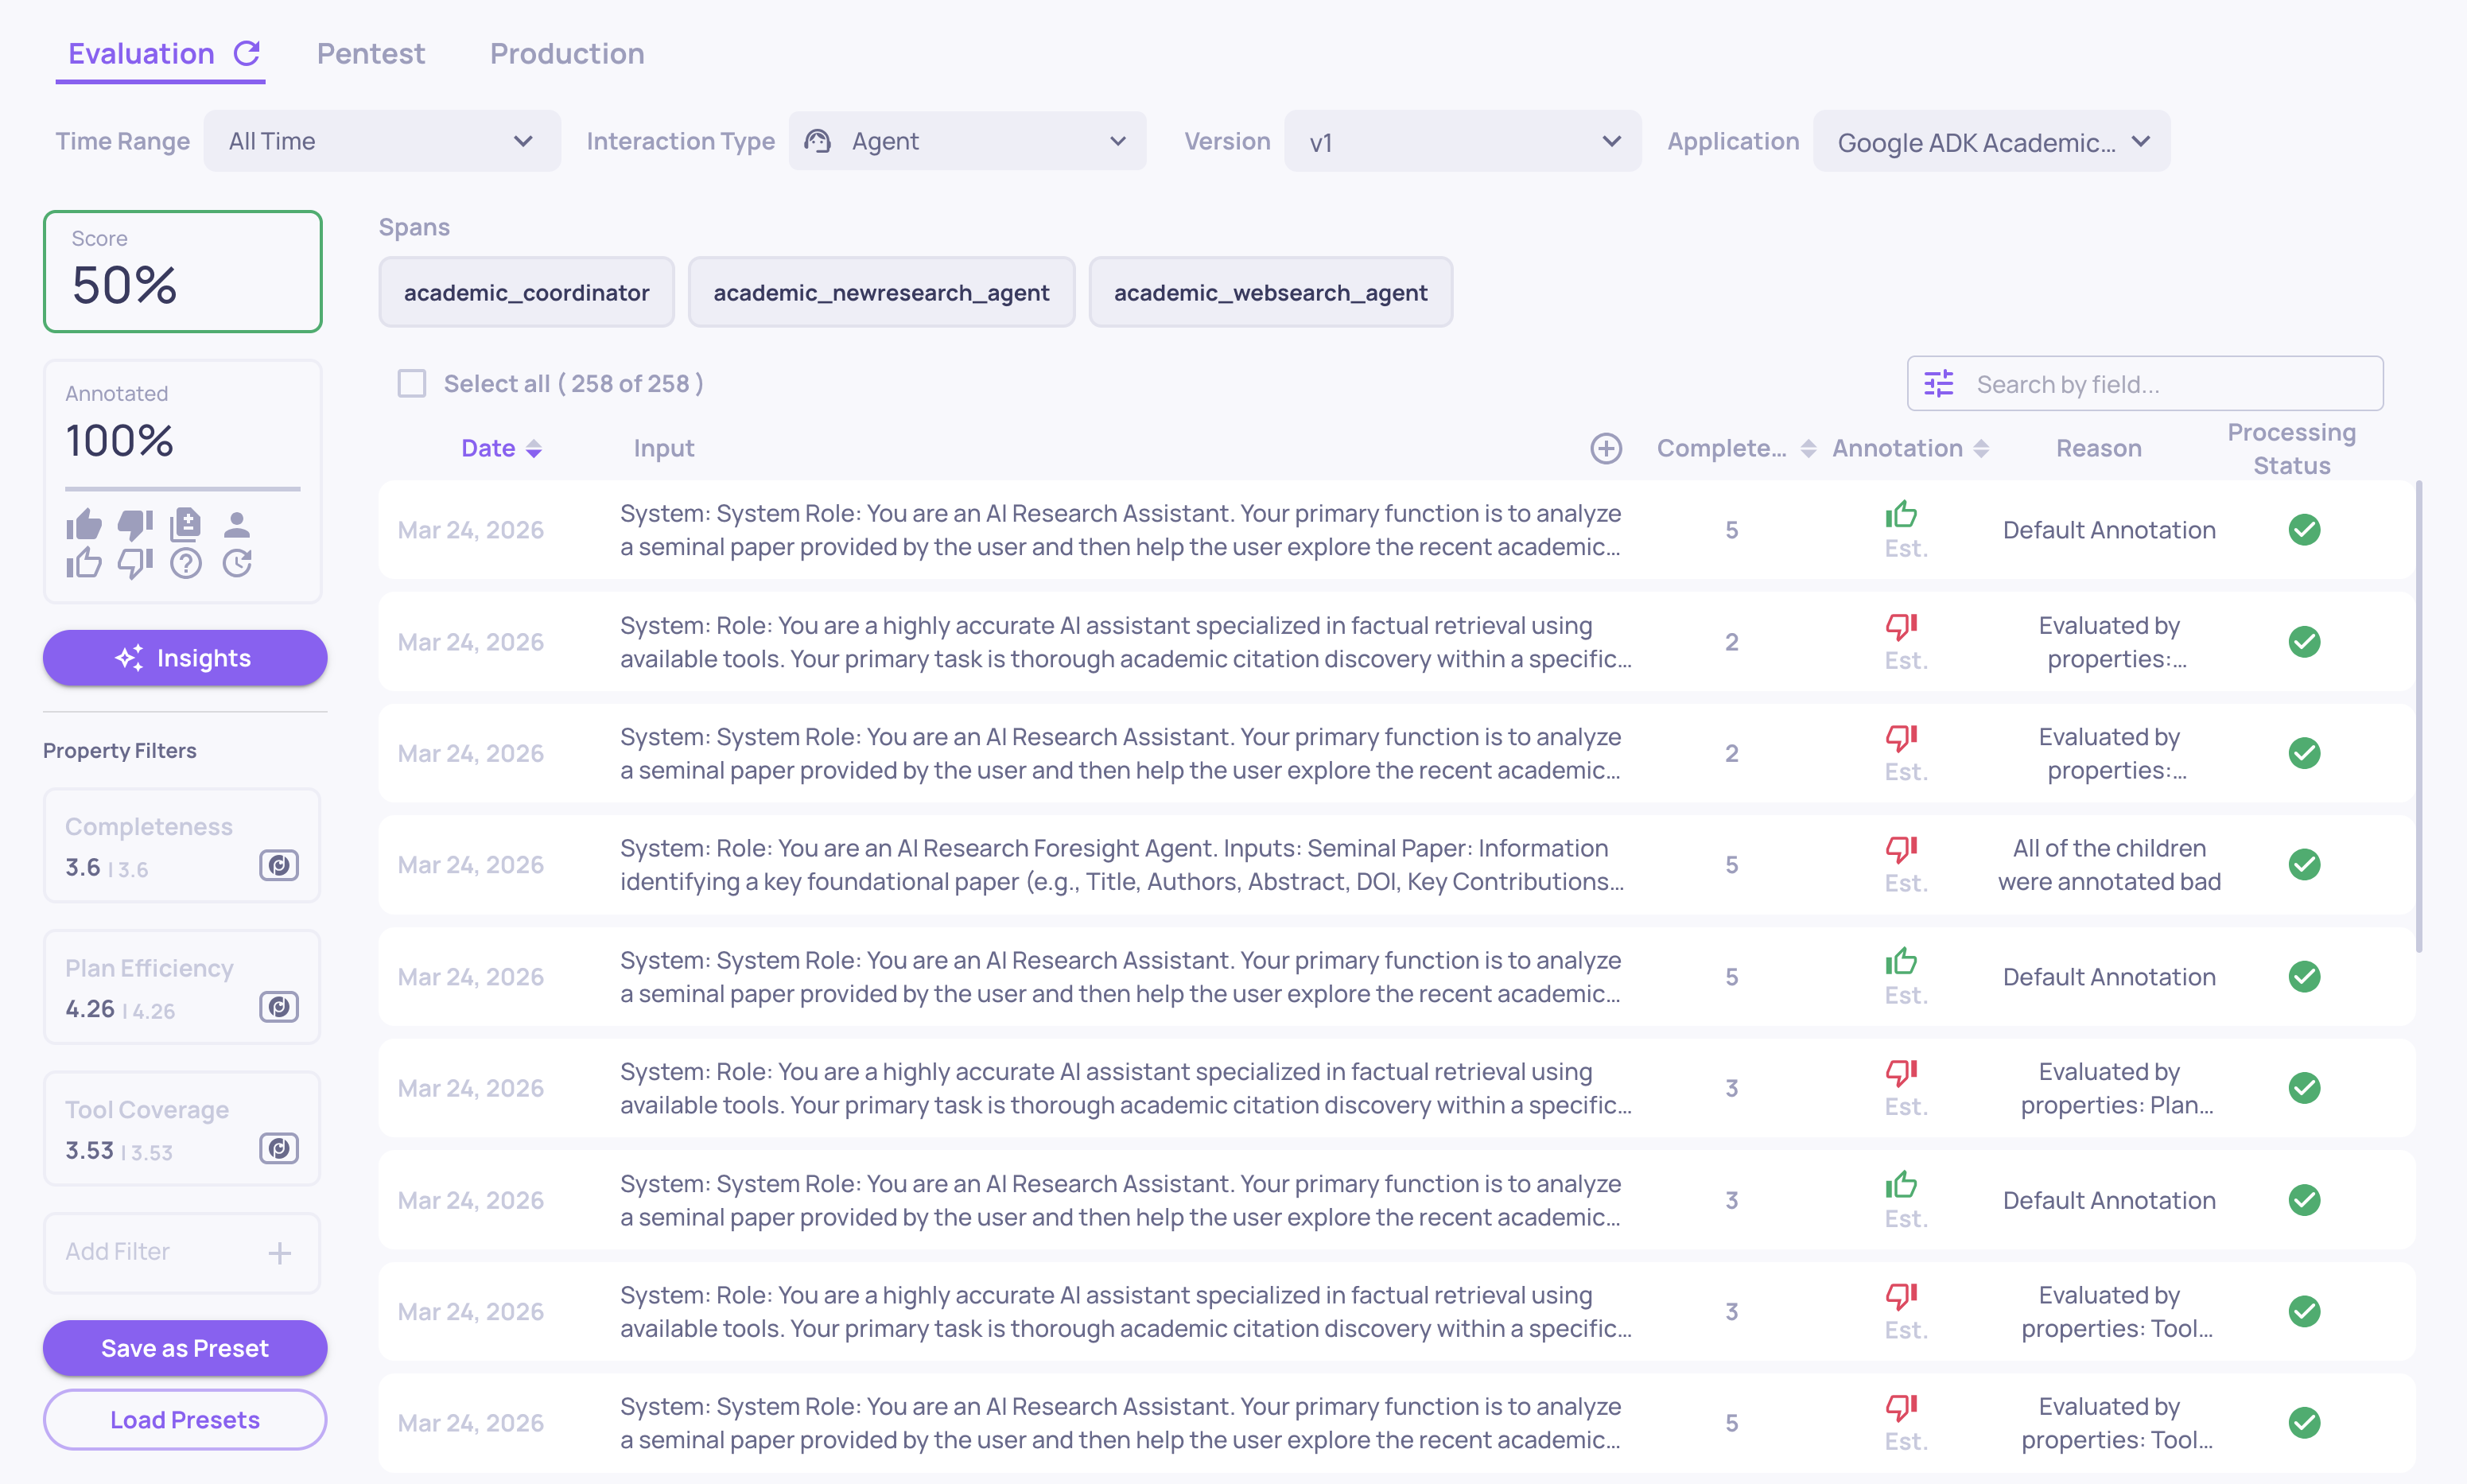
Columns
By default the screen shows:
- Interaction type - Q&A, Agent, Tool, LLM, Retrieval, etc.
- Annotation - Good, Bad, or Unknown (human annotation shown first; estimated annotation as fallback)
- Input - a preview of the user input
- Output - a preview of the model output
- Key property scores - configurable; shows your pinned properties
- Timestamp, Version, Latency, Token count
Click any column header to sort. Click any row to open the full interaction view with all data fields, property scores, and reasoning.
Filtering
The filter bar at the top lets you narrow down by any combination of:
- Annotation - show only Bad, only Good, only Unknown, or mixed
- Interaction type - isolate tool calls, LLM responses, Q&A, etc.
- Version - compare across versions or focus on one
- Environment - EVAL or PROD
- Date range - narrow to a time window
- Property scores - filter by the value of any property (e.g., "Grounded in Context < 0.5")
- Has human annotation / estimated annotation - find interactions that still need human review
- Session - show all interactions belonging to a specific session
Filters compose: you can combine multiple conditions to isolate exactly the segment you care about. For example: "Bad interactions in v2, Q&A type, where Grounded in Context < 0.4" will show only interactions matching all three conditions.
Searching
Use the search bar to do a text search over inputs and outputs. Useful for finding all interactions that mention a specific topic, entity name, or error message.
Preset filters and sorts
Once you've set up a filter and sort combination that's useful for ongoing investigation, save it as a preset so you can return to it with a single click - no reconfiguring.
To create a preset:
- Set up the filters, sort order, and column configuration you want to save
- Click the Presets dropdown at the top of the screen
- Click Save as preset, give it a name, and confirm
Presets capture the full state of the screen: active filters, sort column and direction, and which columns are visible.
To use a preset:
- Click the Presets dropdown and select one - the screen immediately applies that filter, sort, and column configuration
- Switch between presets anytime; your current state is replaced by the preset's state
To manage presets:
- Rename - open the dropdown, hover a preset, and click the edit icon
- Update - load the preset, adjust filters/sort, and choose Update preset to overwrite
- Delete - hover a preset in the dropdown and click the remove icon
- Share - presets are saved per user by default; mark a preset as shared to make it available to everyone in your workspace
Common preset examples:
-
"Bad Q&A this week" - annotation = Bad, interaction type = Q&A, date range = last 7 days
-
"Low Groundedness" - Grounded in Context < 0.5, sorted by score ascending
-
"Needs human review" - has estimated annotation but no human annotation
-
"Slowest tool calls" - interaction type = Tool, sorted by latency descending
The Sessions Screen
The Sessions screen lists your data grouped by session - each row is one complete run, containing one or more interactions. For agentic workflows, each session is a full trace from the initial user request through every span.
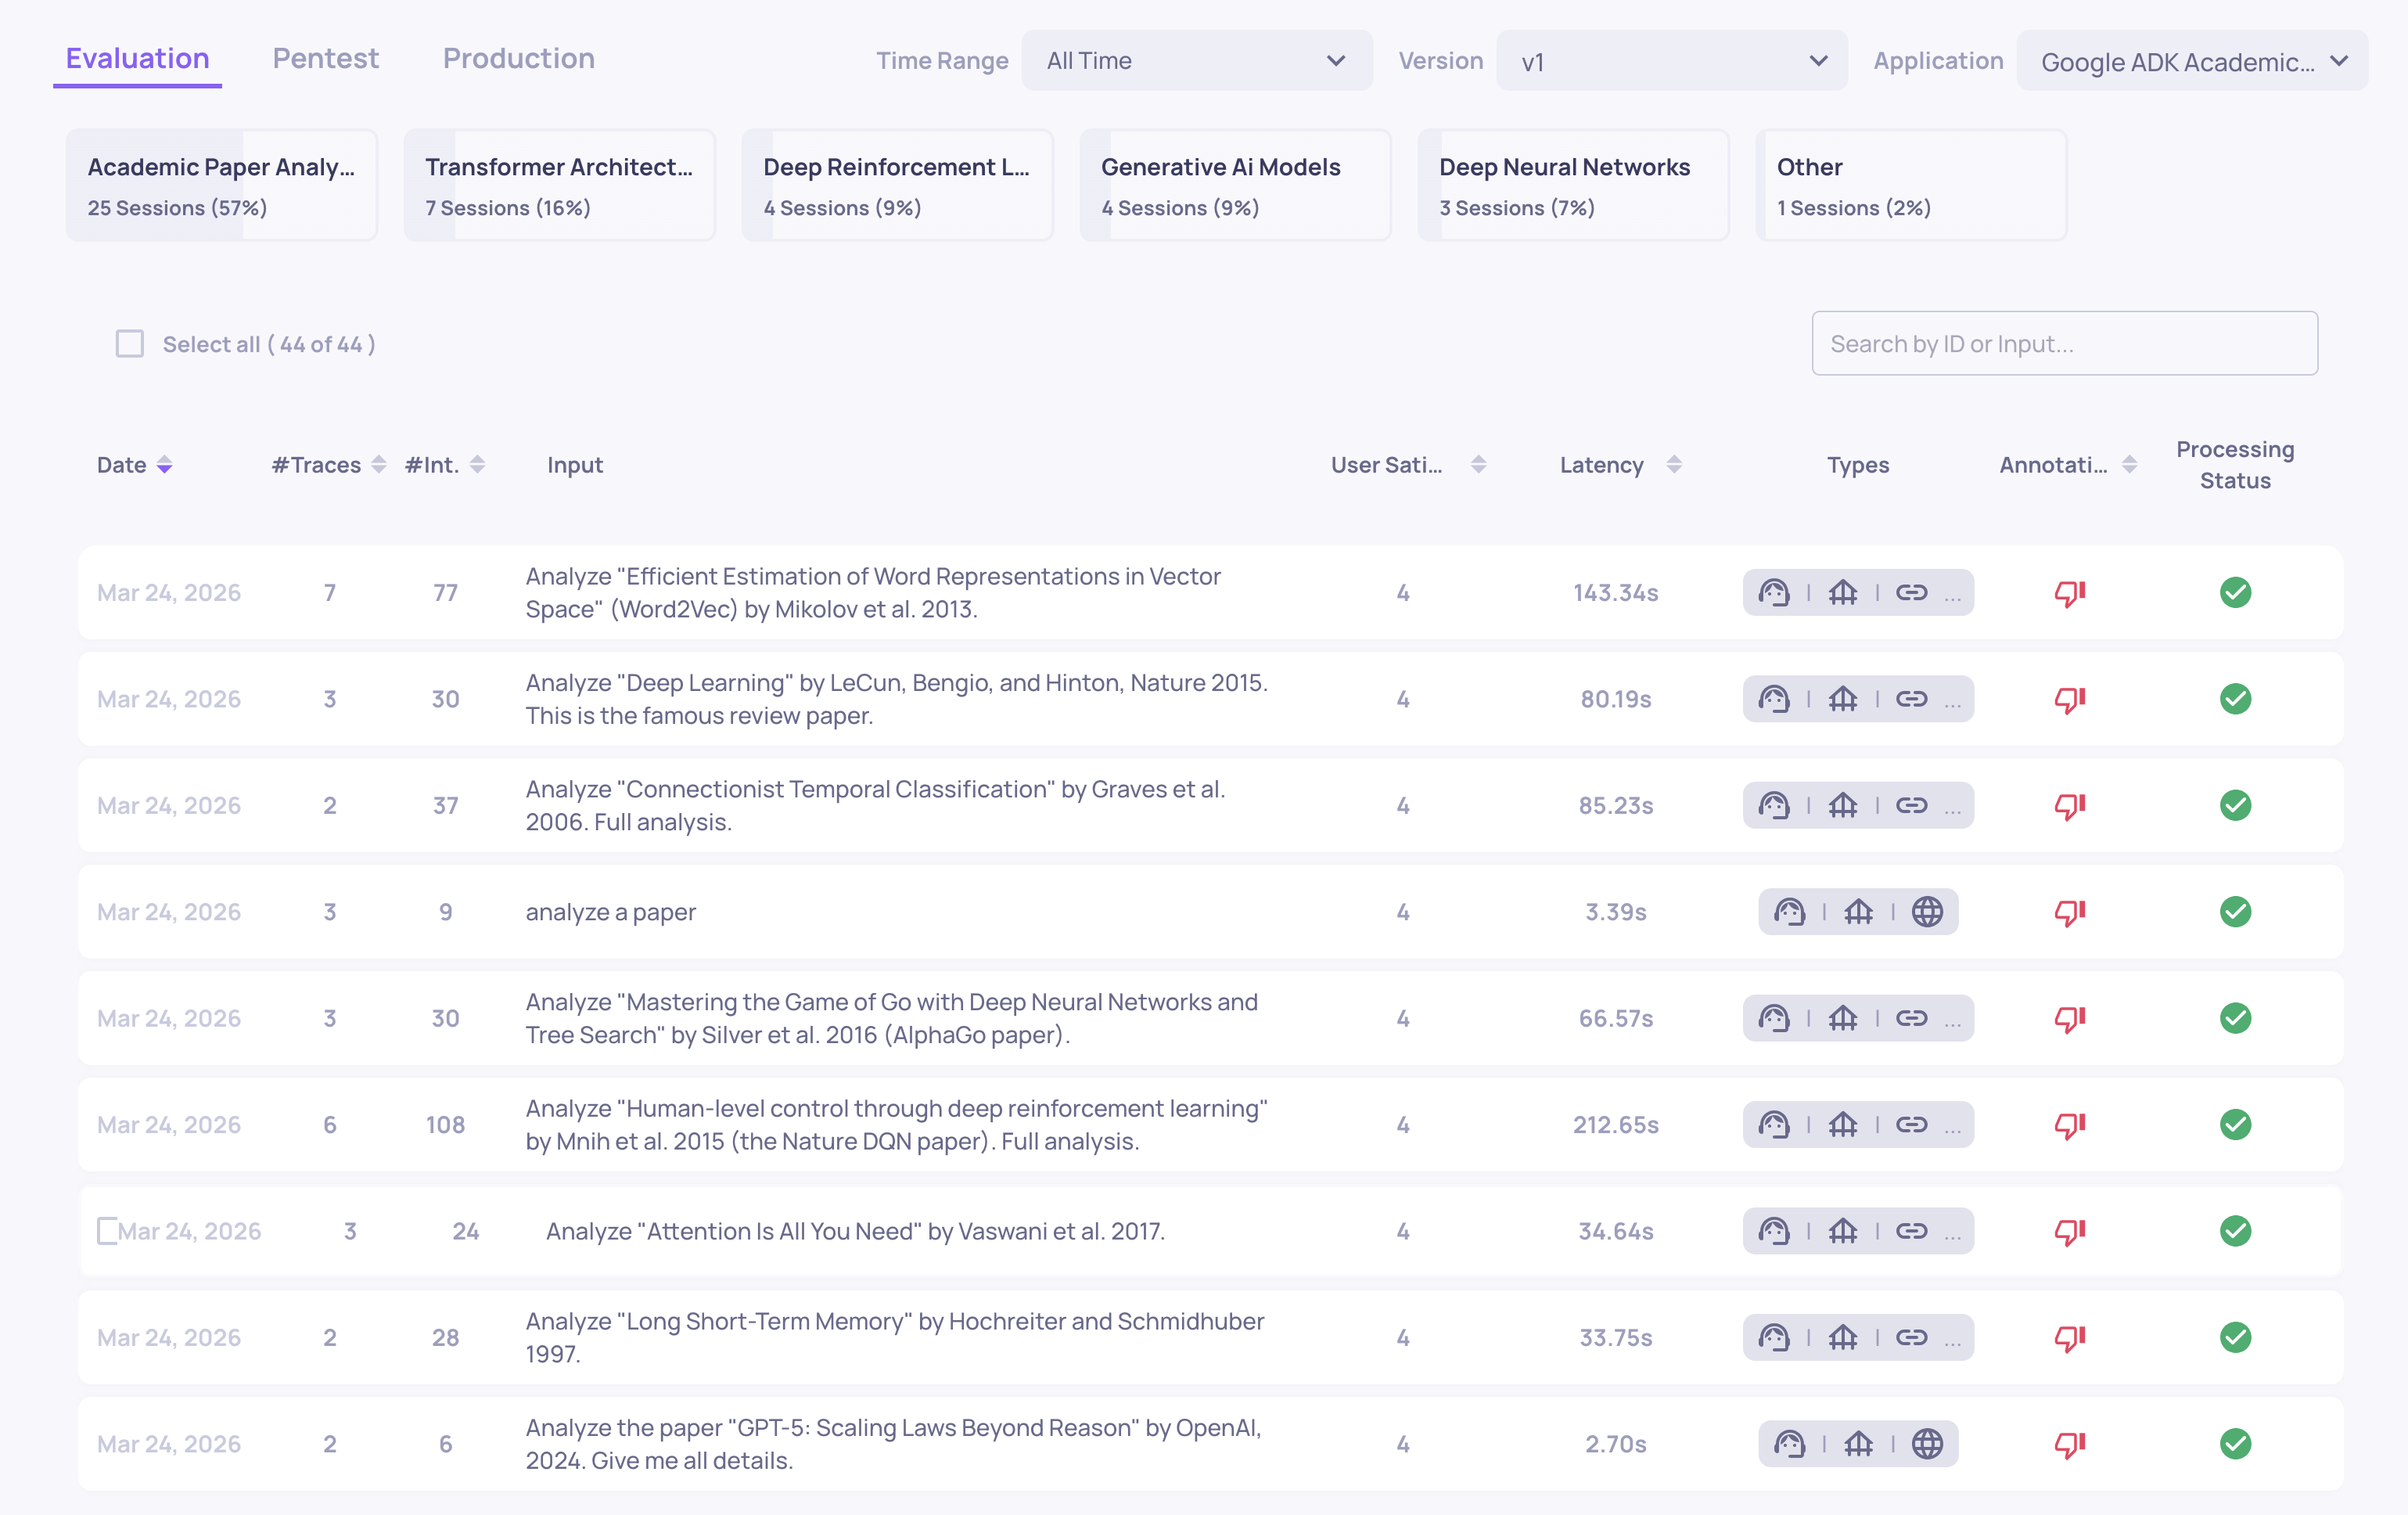
What the screen shows
- Session ID - usually the trace ID, or a session/group name for multi-session groupings
- Annotation - the aggregated session-level annotation
- Session topic - a summary of what the session was about
- Start timestamp
- Aggregated metrics - total latency, token count, cost, and number of interactions
- Key session-level property scores - e.g., Intent Fulfillment
Filtering sessions
The same filter dimensions are available at the session level - annotation, version, date range, and session-level property scores. Filtering by a span-level property (e.g., "any interaction in this session has Tool Completeness < 3") is also supported, letting you surface sessions that contain at least one problematic step.
Navigating from sessions to interactions
Click any session row to open the single session view - the full trace with the left-panel hierarchy, data fields, properties, and annotations for each span. From there, you can click any span to inspect it in detail.
→ See Navigating the Session View for a full walkthrough of the single session view.
Using these screens for investigation
A typical investigation flow:
- Start broad - open the Interactions or Sessions screen, filter by Bad annotation and the version you're investigating
- Sort by a property - if you suspect a specific failure mode, sort by the relevant property score to see the worst cases first
- Look for patterns - scan the inputs and outputs of low-scoring interactions. Are they clustered around a topic? A specific user type? A particular query format?
- Drill into individual cases - click into specific interactions to read the full reasoning behind a property score
- Hand off to RCA - once you've identified a pattern, run failure mode analysis to get a structured diagnosis across all failures at once
→ See Root Cause Analysis for the next step.
Updated 3 months ago