Observability and System Metrics
Quality scores tell you whether the agent is doing the right thing. Operational metrics tell you whether the agent is doing that thing efficiently - or at all. For a multi-agent system, operational signals are often the fastest way to spot a problem.
The System Metrics Deepchecks Captures Automatically
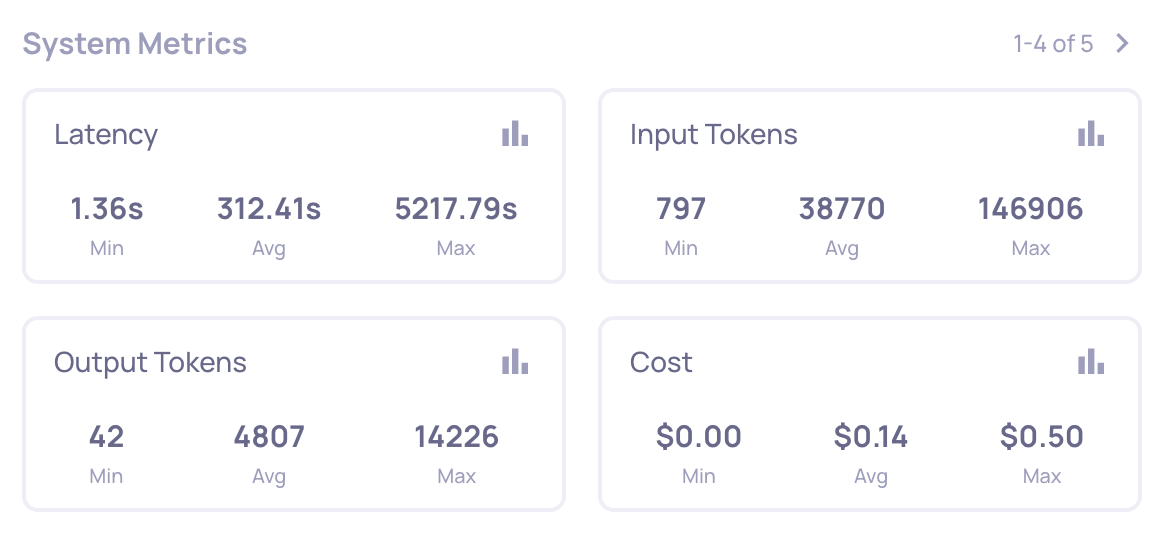
Because the Google ADK auto-instrumentation captures every span with full timing, model info, and token counts, Deepchecks computes the following without any extra setup:
- Latency - per span, per trace, and per session. You can see which agent or tool is dominating the wall-clock time of a conversation.
- Input / output / total tokens - per LLM span and aggregated up the tree.
- Cost - derived from model + token usage, aggregated the same way.
- Span count per session - how many steps the agent is running for a given request.
- Error rate - how often tools and LLM calls end with a non-
OKstatus.
These are available as columns, filters, and sort keys on the Interactions and Sessions screens, and as system-level charts on the Overview screen upon selecting one of the filters.
Cost per Session: Multi-Agent Systems Burn Tokens
A single multi-turn session through the Academic Researcher can easily involve 10+ LLM calls across the three agents. The coordinator makes a call, delegates to the web-search agent (which makes its own LLM call to decide how to search, then another to summarize), then delegates to the new-research agent (another LLM call), and potentially loops. Multi-agent apps routinely use 10x-100x more tokens than a traditional single-call RAG pipeline.
Deepchecks makes this visible at three levels:
- Per span - which individual LLM call is the expensive one.
- Per trace - what a single turn costs end-to-end.
- Per session - what the full conversation costs, including all turns.
This is what lets you answer "is GPT-4o worth the cost delta versus GPT-4.1-mini on this workload?" with data rather than intuition.
Latency: Finding the Stuck Runs
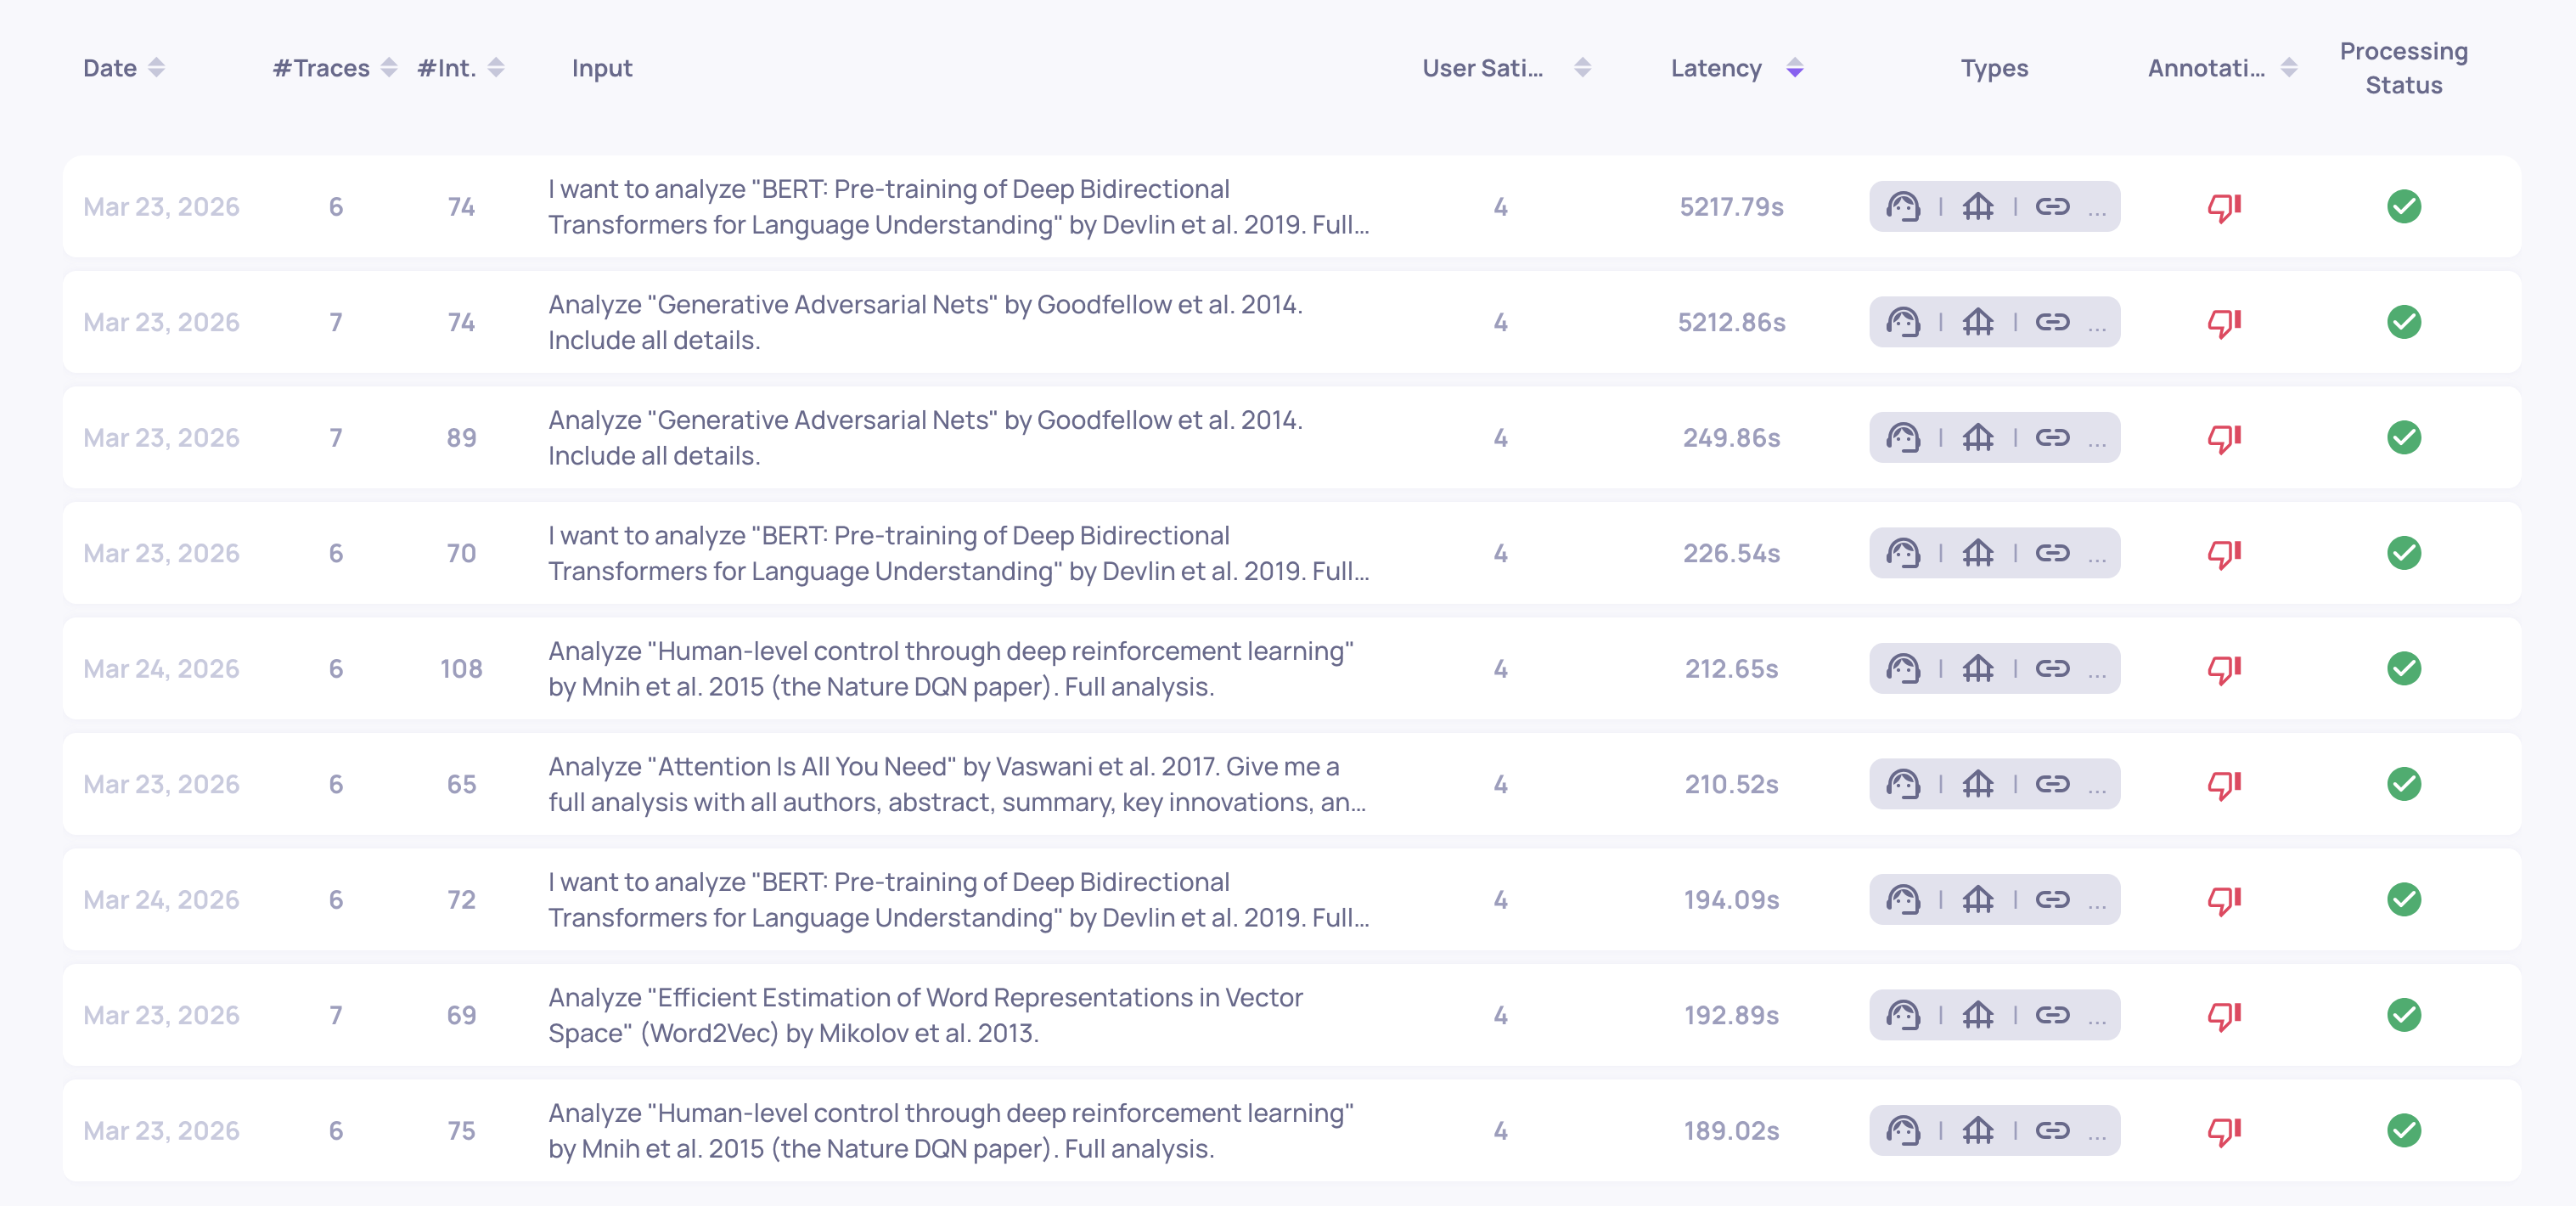
Agent systems have a characteristic failure mode that is invisible to quality metrics: runs that never finish. A tool hangs, a retry loop spins, an LLM call stalls. The output may still eventually arrive, but at the cost of a wildly long trace.
Sorting sessions by latency surfaces these immediately. In our dataset, sorting by max trace latency exposed a run approaching 5,000 seconds - orders of magnitude above the median. That is not a quality problem; it is a runtime issue (a stuck tool call, a retry loop, or an agent that cannot decide to stop). None of the per-span quality properties would have flagged it - only the system metric did.
Zero-Token LLM Calls
Another operational signature to watch for: LLM spans that report zero input or output tokens. These are LLM invocations that never actually executed end-to-end - the agent fired off a call that failed silently at the framework level. You only notice because the token counts don't add up.
Filtering the LLM interaction type by output_tokens = 0 is an easy way to find them.
Why Operational Signals Matter for Debugging, Not Just Monitoring
For most systems, system metrics are "observability for oncall". For agents, they are also a debugging tool - they let you find failures that quality evaluation missed because the agent produced something that looked okay to score. Stuck runs, zero-token calls, and cost outliers are almost always caused by a bug in agent logic, not by a model being wrong.
Where to Go Next
Between the Agent interaction type scoring badly and the operational signals pointing at the same sub-agent, we now have a strong hypothesis about where the problem is. Next we narrow it down to a specific failure pattern using Root Cause Analysis.