0.42.0 Release Notes
Deepchecks LLM Evaluation 0.42.0 Release
We're excited to announce version 0.42 of Deepchecks LLM Evaluation. This release focuses on deeper session-level insights, streamlined configuration, and enterprise-grade governance. Highlights include session-level properties that evaluate entire conversations, a visual auto-annotation editor that replaces manual YAML editing, multi-turn dataset support, and new audit and usage tracking tools for workspace administrators.
Deepchecks LLM Evaluation 0.42.0 Release:
🧵 Session-Level Properties
🎛️ Visual Auto-Annotation Editor
💬 Multi-Turn Datasets
📋 Audit Logs & Usage Export
🔔 In-App Release Notes
What's New and Improved?
Session-Level Properties
Evaluating individual interactions only tells part of the story. Session-level properties analyze entire multi-turn conversations to detect patterns that only emerge across multiple exchanges - like user frustration building over time, instruction drift, or whether all parts of a complex request were ultimately fulfilled.
Two built-in session properties are now available:
- User Satisfaction - Scores how satisfied the user appears throughout the conversation by detecting signals like repeated corrections, resignation, or genuine enthusiasm
- Intent Fulfillment - Evaluates whether the assistant addressed all user requests across the session, accounting for recovery from early mistakes and multi-step task completion
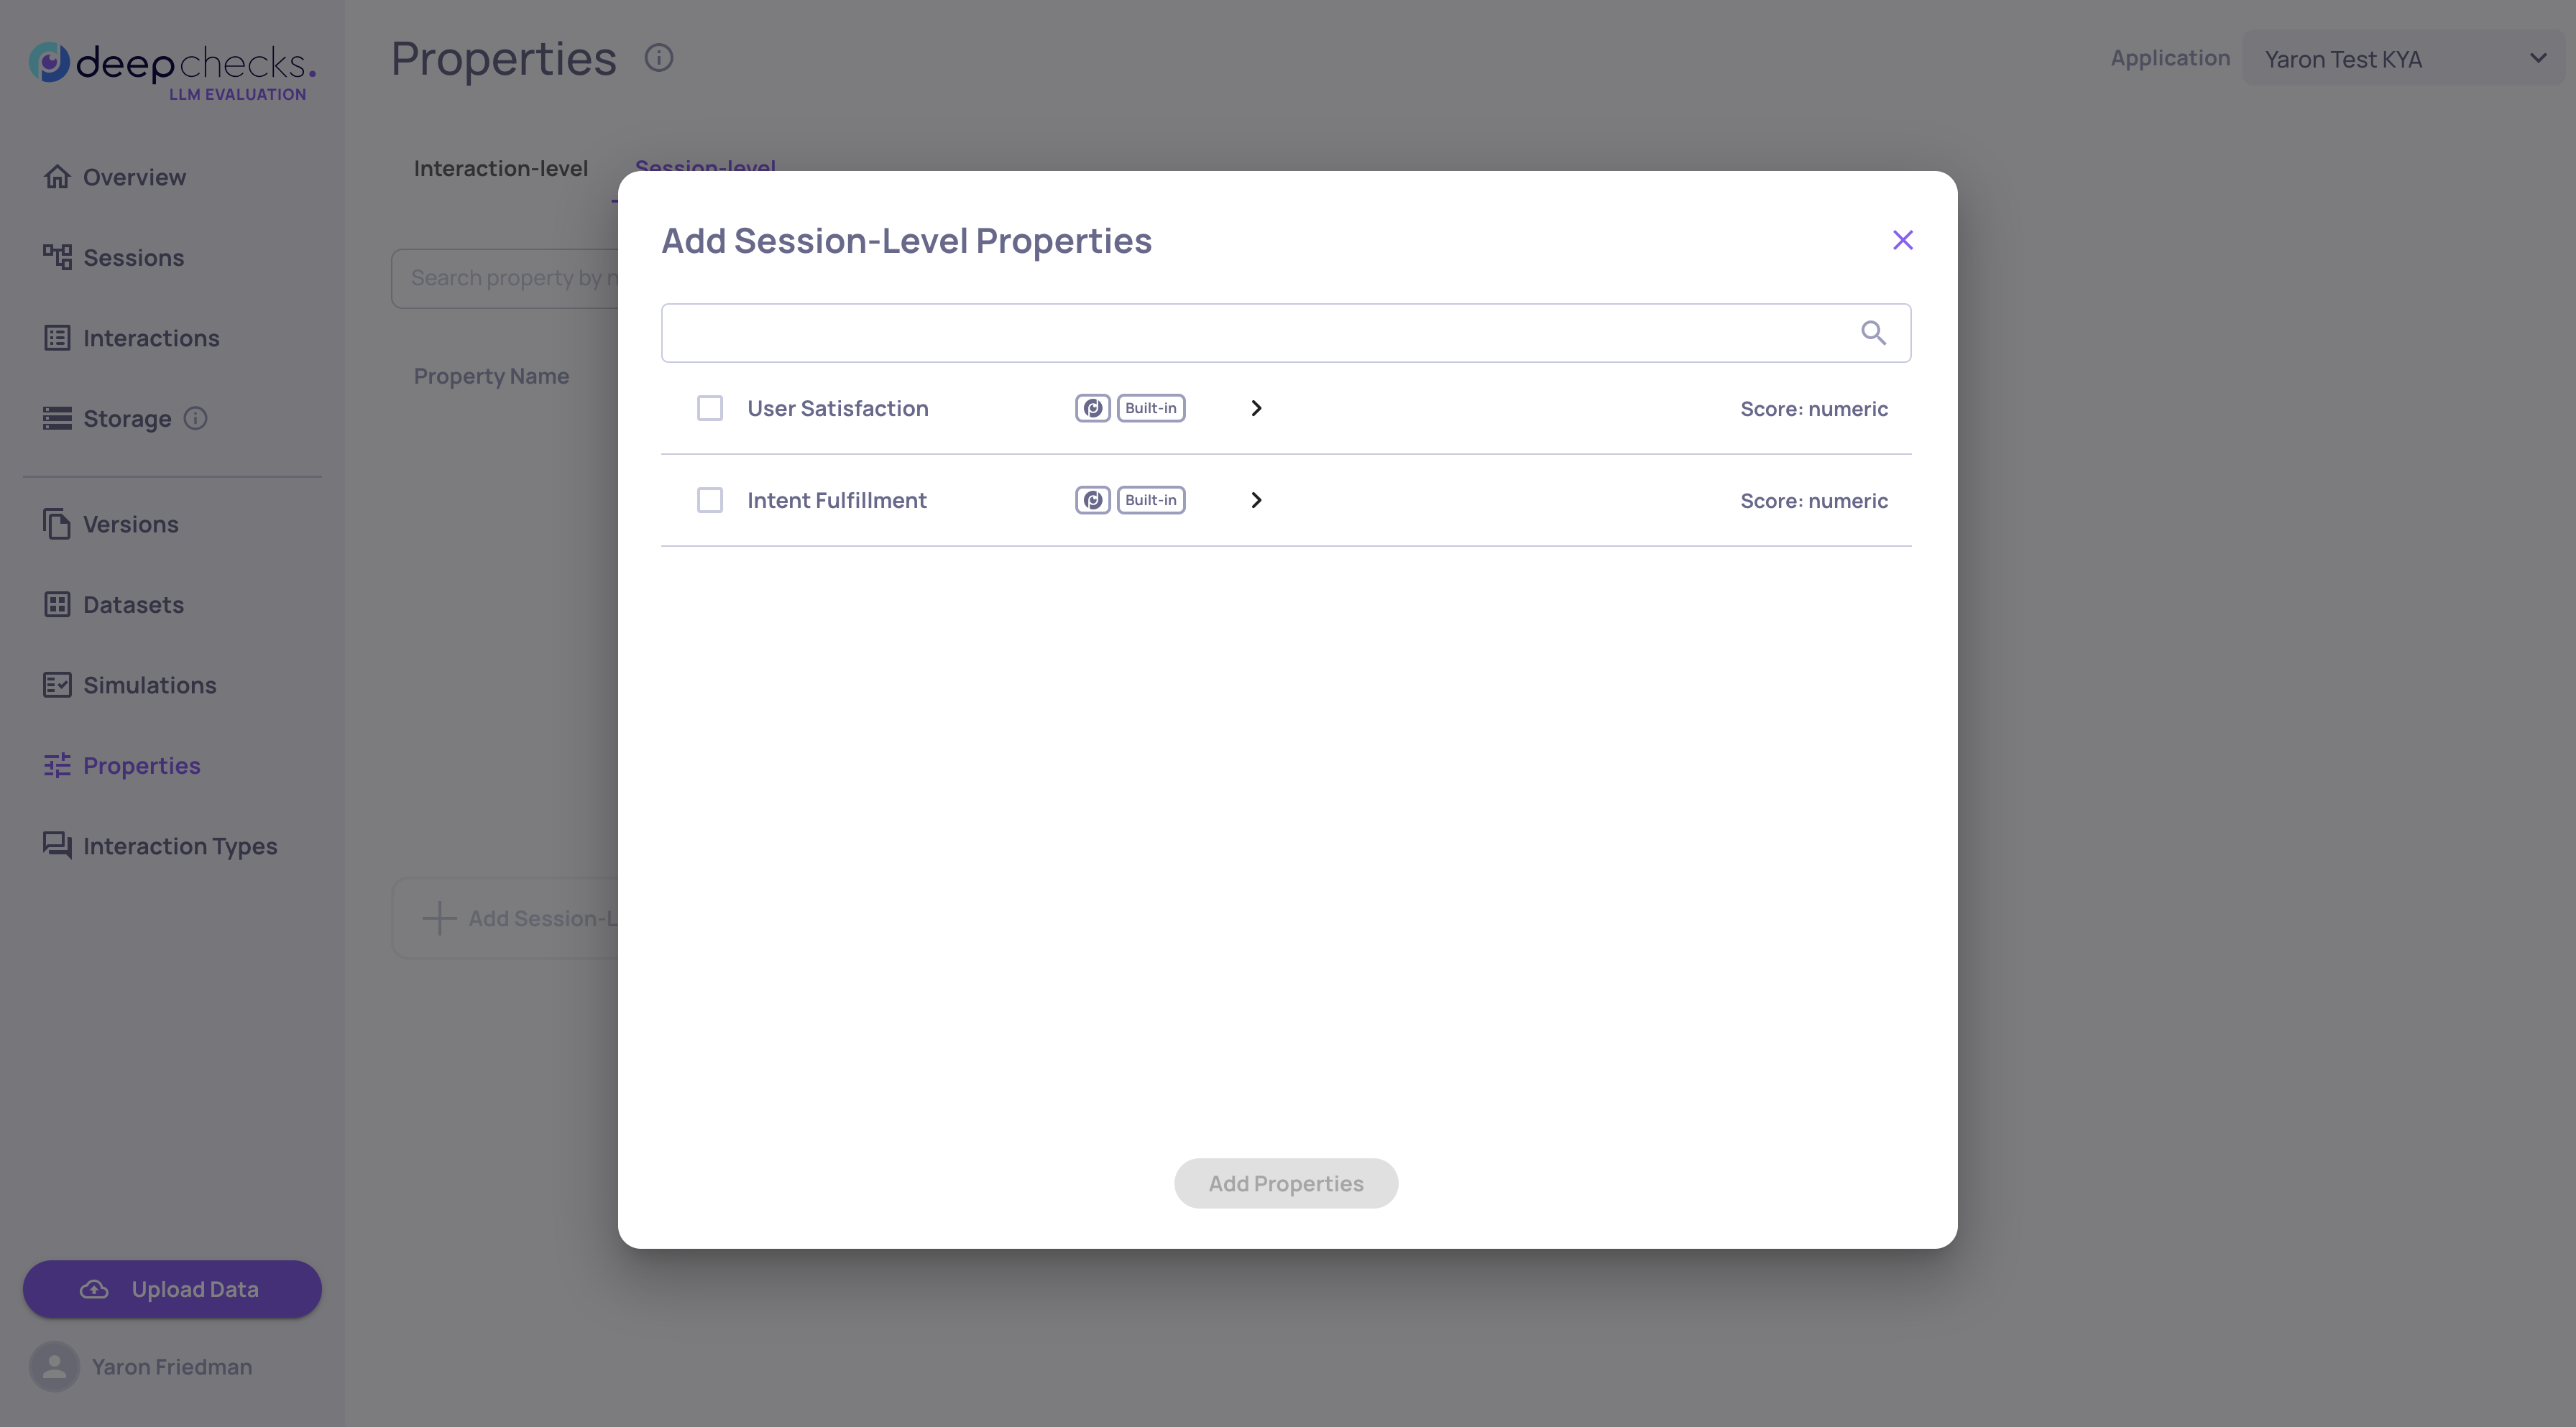
Each property reviews the full session transcript and returns a score, and reasoning with specific turn citations. You can set pass/fail thresholds and filter and sort sessions by property scores.
Session-level properties complement interaction-level properties to give you a holistic view of conversation quality - not just whether individual responses were good, but whether the overall experience succeeded.
Read the full Session-Level Properties documentation →
Visual Auto-Annotation Editor
Configuring auto-annotation rules no longer requires editing YAML files by hand. The new visual editor provides a drag-and-drop interface for building and refining your annotation pipeline directly in the UI.
What's new:
-
Visual Block Builder - Create ordered blocks of conditional rules that determine whether interactions are annotated as Good, Bad, or Unknown
-
Drag-and-Drop Reordering - Rearrange block priority with simple drag-and-drop, since the first matching block determines the annotation
-
Built-in Distribution Insights - See histograms showing how your property values are distributed, with real-time previews of how many interactions each condition would match
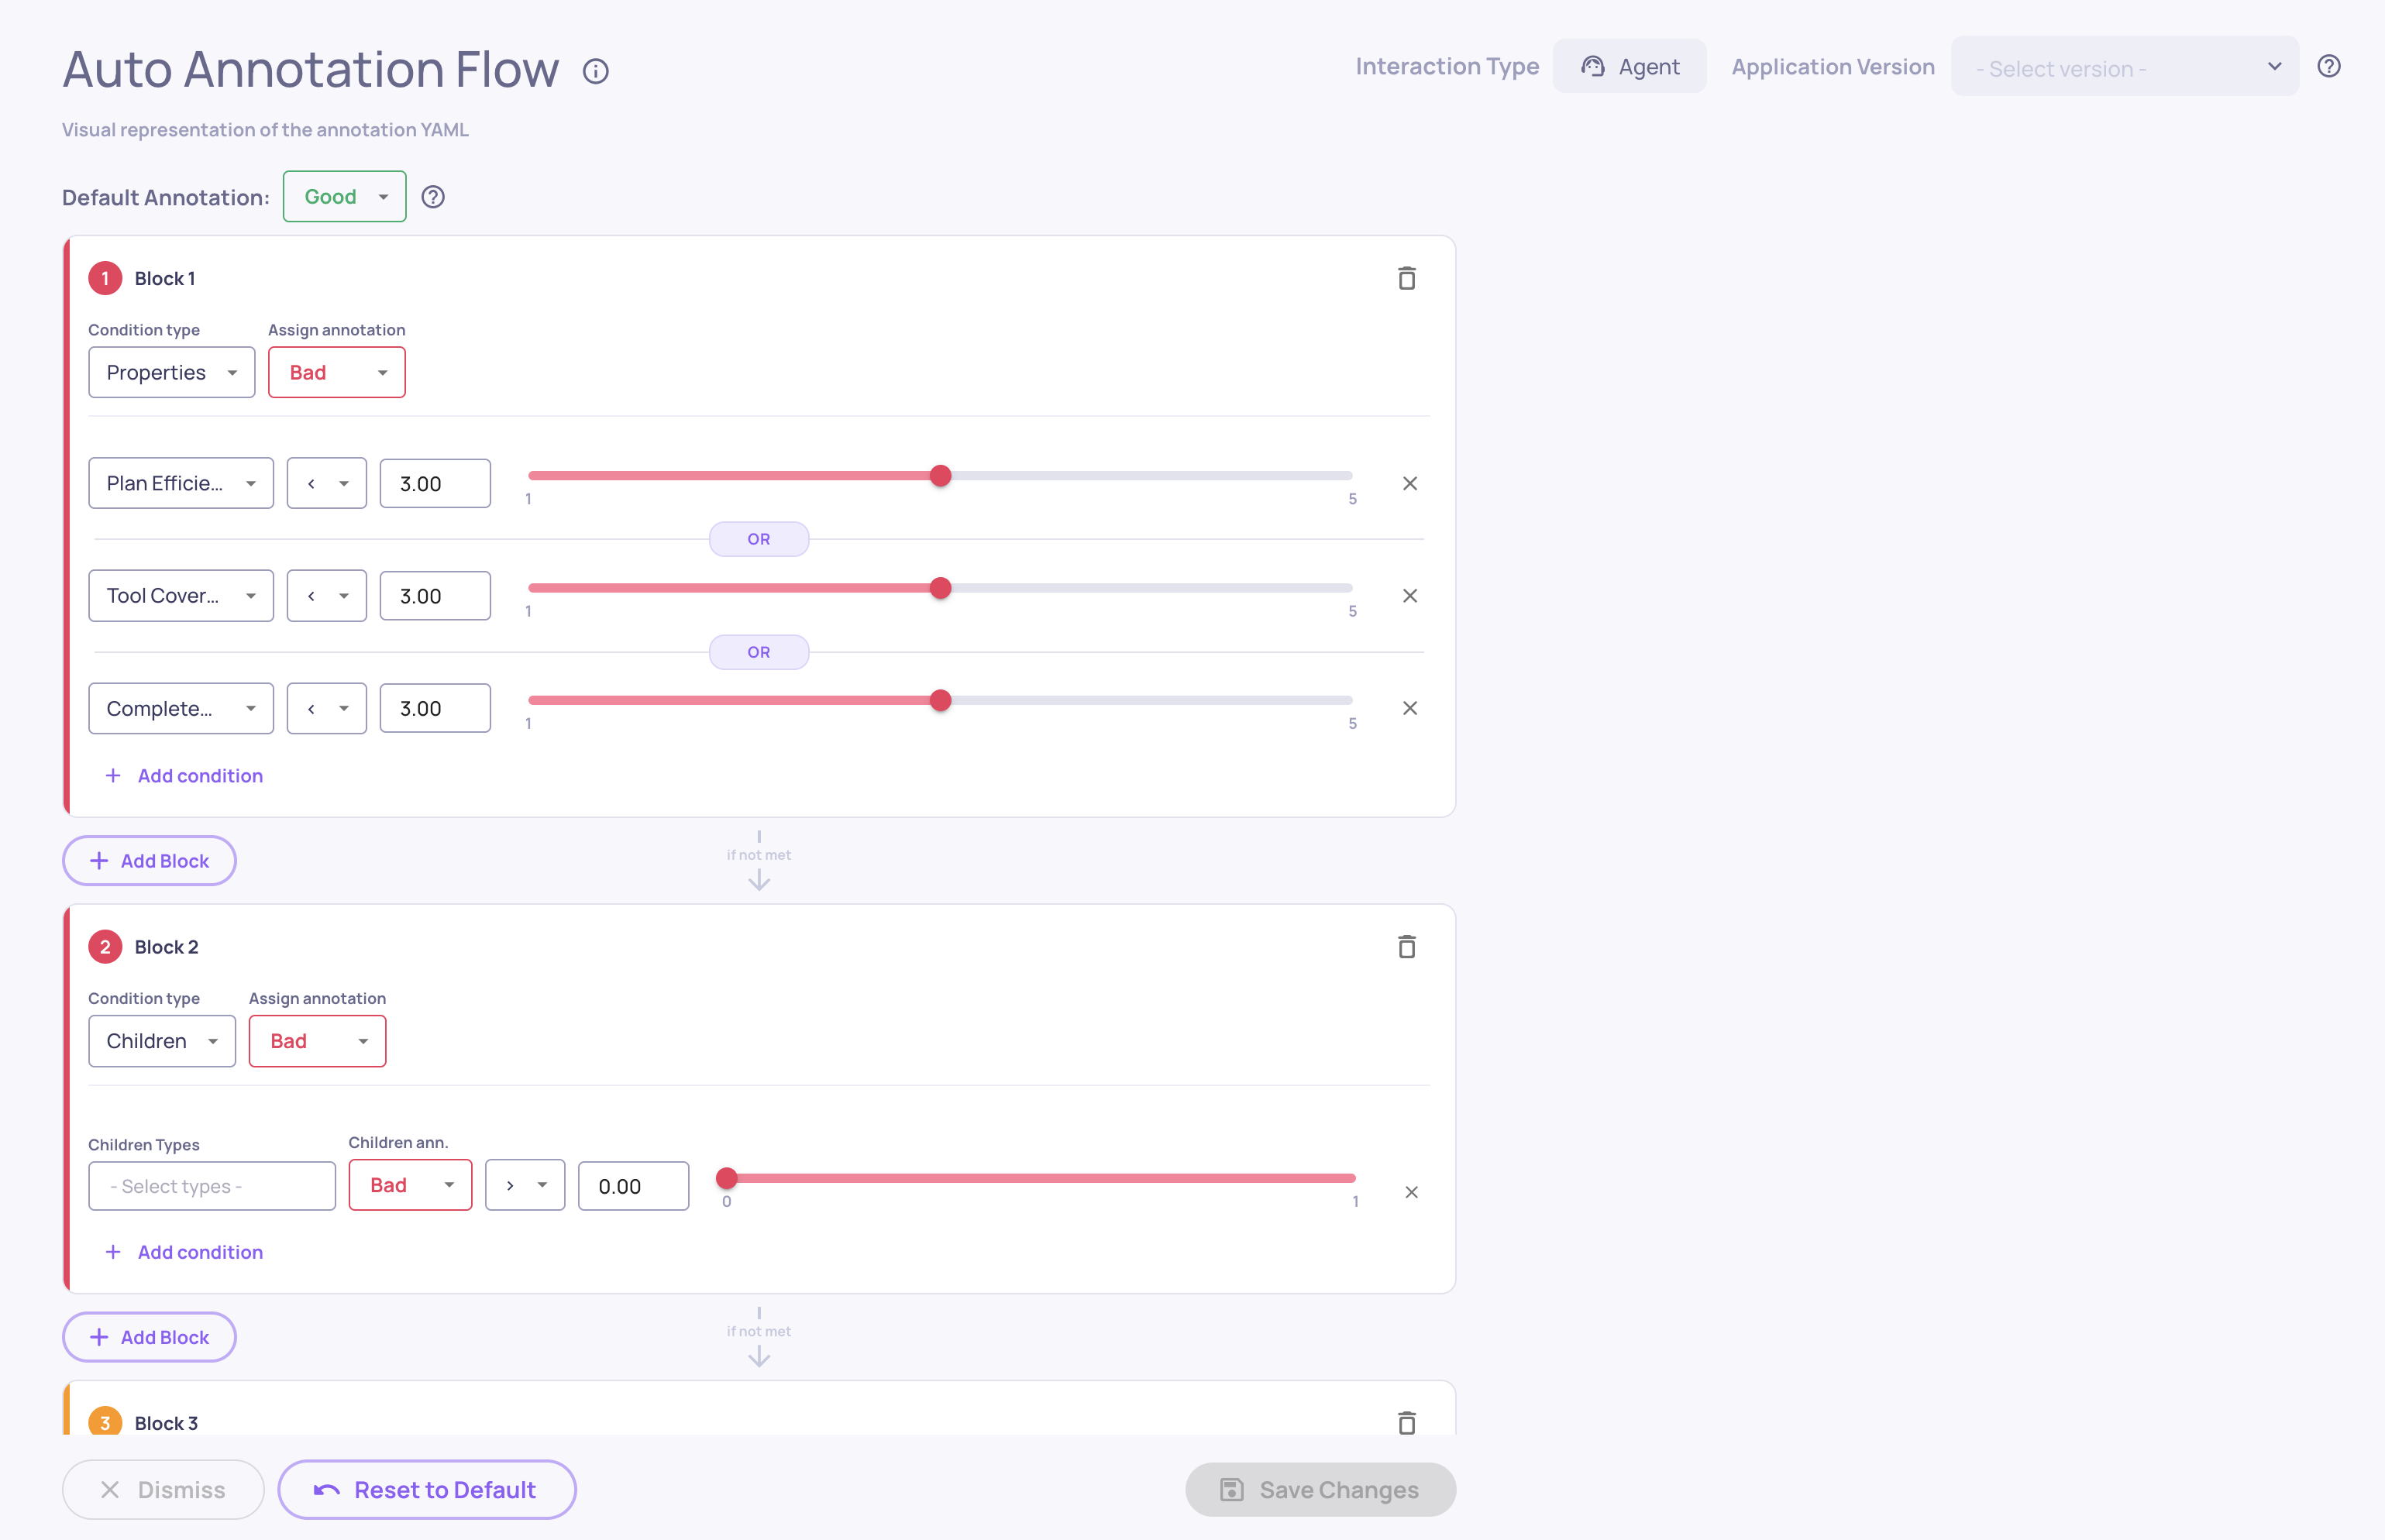
The editor reads and writes the same YAML configuration used by the pipeline, so you can switch between the visual editor and the raw YAML at any time. Access it from Interaction Types → Choose Interaction Type → Edit YAML.
Read the full UI Auto-Annotation Configuration documentation →
Multi-Turn Datasets
Datasets now support multi-turn conversations, enabling you to build test suites that evaluate how your application handles extended, back-and-forth interactions - not just isolated single-turn exchanges.
What's new:
- Multi-Turn Dataset Type - Create datasets specifically designed for conversational testing, where each sample represents an entire conversation scenario
- Simulated User Behavior - Each sample defines a user goal along with behavioral dimensions like persistence, clarity, frustration, and directness, creating realistic and diverse conversation dynamics
- AI Generation for Multi-Turn - Describe your application and generate diverse multi-turn scenarios automatically, with AI creating varied user goals and combining behavioral dimensions for comprehensive coverage
- AI-Generated Labeling - Samples created through AI generation are automatically marked with a sparkle icon. If you manually edit an AI-generated sample, the label updates to reflect that it was edited, so you always know the origin and modification history of each sample
Audit Logs & Usage Export
Two new tools give workspace administrators better visibility into platform activity and resource consumption.
Audit Logs
Every create, update, and delete action across the platform is now automatically logged. Administrators can download audit logs as a CSV file for any date range, covering who performed each action, what was changed, and when. Sensitive data like API keys and credentials are automatically redacted. Access audit log downloads from the Workspace Settings.
Read more about audit logs in our documentation →
Granular Usage Export
A new Download Usage button in Workspace Settings → Usage lets administrators export token consumption data as a CSV. The export breaks down usage by application, version, environment, service type, and model, with separate input and output token counts for precise cost analysis. Select any date range to generate a detailed usage report.
In-App Release Notes
You'll now see a release notes popup when your Deepchecks instance is upgraded to a new version. The popup highlights what's new and links to the full changelog, so your team stays informed about new features without needing to check external documentation. You can dismiss it with a "don't show again" option, and it will only reappear when the next version is deployed.