0.33.0 Release Notes
This release focuses on clarity, speed, and smarter insights: visualize property performance over time, optimize evaluation guidelines with AI, track processing status at a glance, and jump straight to relevant data with new hyperlinks and filters.
Deepchecks LLM Evaluation 0.33.0 Release:
- 🤖 AI-assisted optimization for property guidelines
- 📈 Property graphs view in both Evaluation and Production
- ⏳ Processing status indicators for interactions and sessions
- 🔍 Filter-by-click from score-breakdown component
- ❓ Reasoning explanations for N/A properties
- 🔗 Hyperlinked examples in Property Failure Mode Analysis
What's New and Improved?
AI-Assisted Optimization of Property Guidelines
Writing robust prompt guidelines can be hard - especially without prompt engineering experience. Now, after you fill in essential fields (property name, guidelines, interaction steps), an Optimize button appears. Clicking it opens an expansion panel:
- Your current input is pre-filled as “Additional Guidelines.”
- All relevant context (name, description, categories, examples, steps) is sent to a research-backed LLM, which returns polished, AI-generated Suggested Guidelines—fully editable before saving.
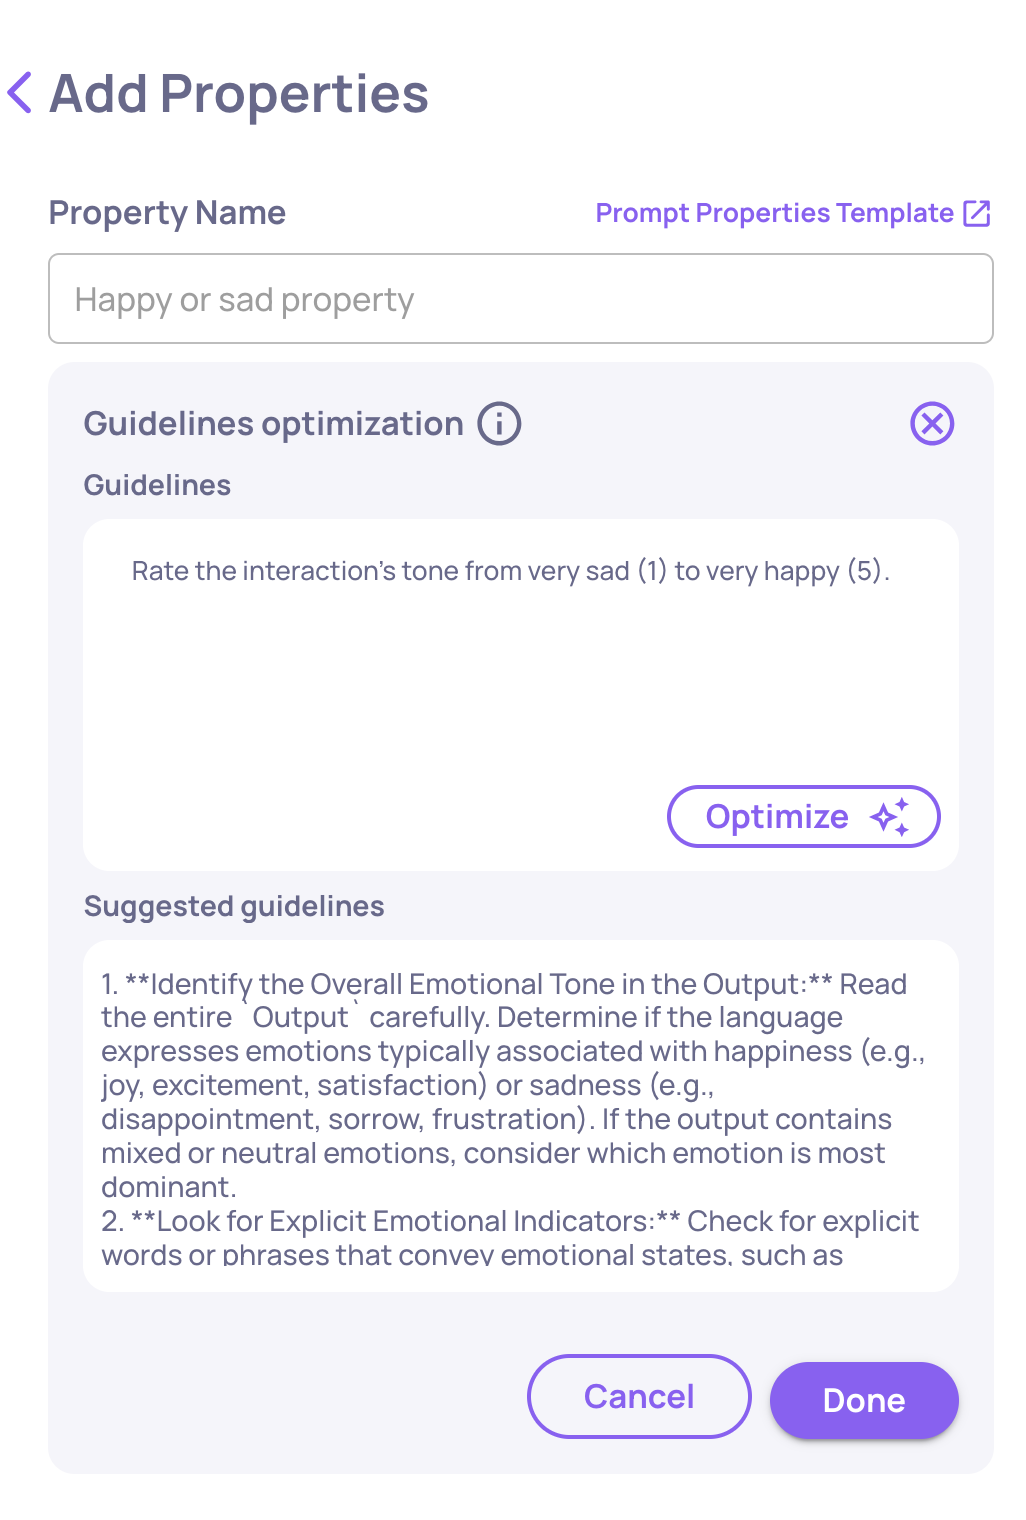
Suggested guidelines after optimization
- You can save to overwrite your draft, or cancel to retain it. And if you adjust your draft, Optimize becomes available again for further refinement.
Why it matters: More context means smarter suggestions—so the richer your original details, the better the AI helps refine them.
See more details here: https://llmdocs.deepchecks.com/docs/improve-guidelines-with-ai
Property Graphs View in Evaluation & Production
We’ve added a versatile graphs option to the Overview screen:
- Evaluation environment: Visualize property score distributions, helping you spot outliers or skewed metrics at a glance.
- Production environment: Track average property scores over time. Compare these alongside the overall production score to pinpoint which properties most influence trends.
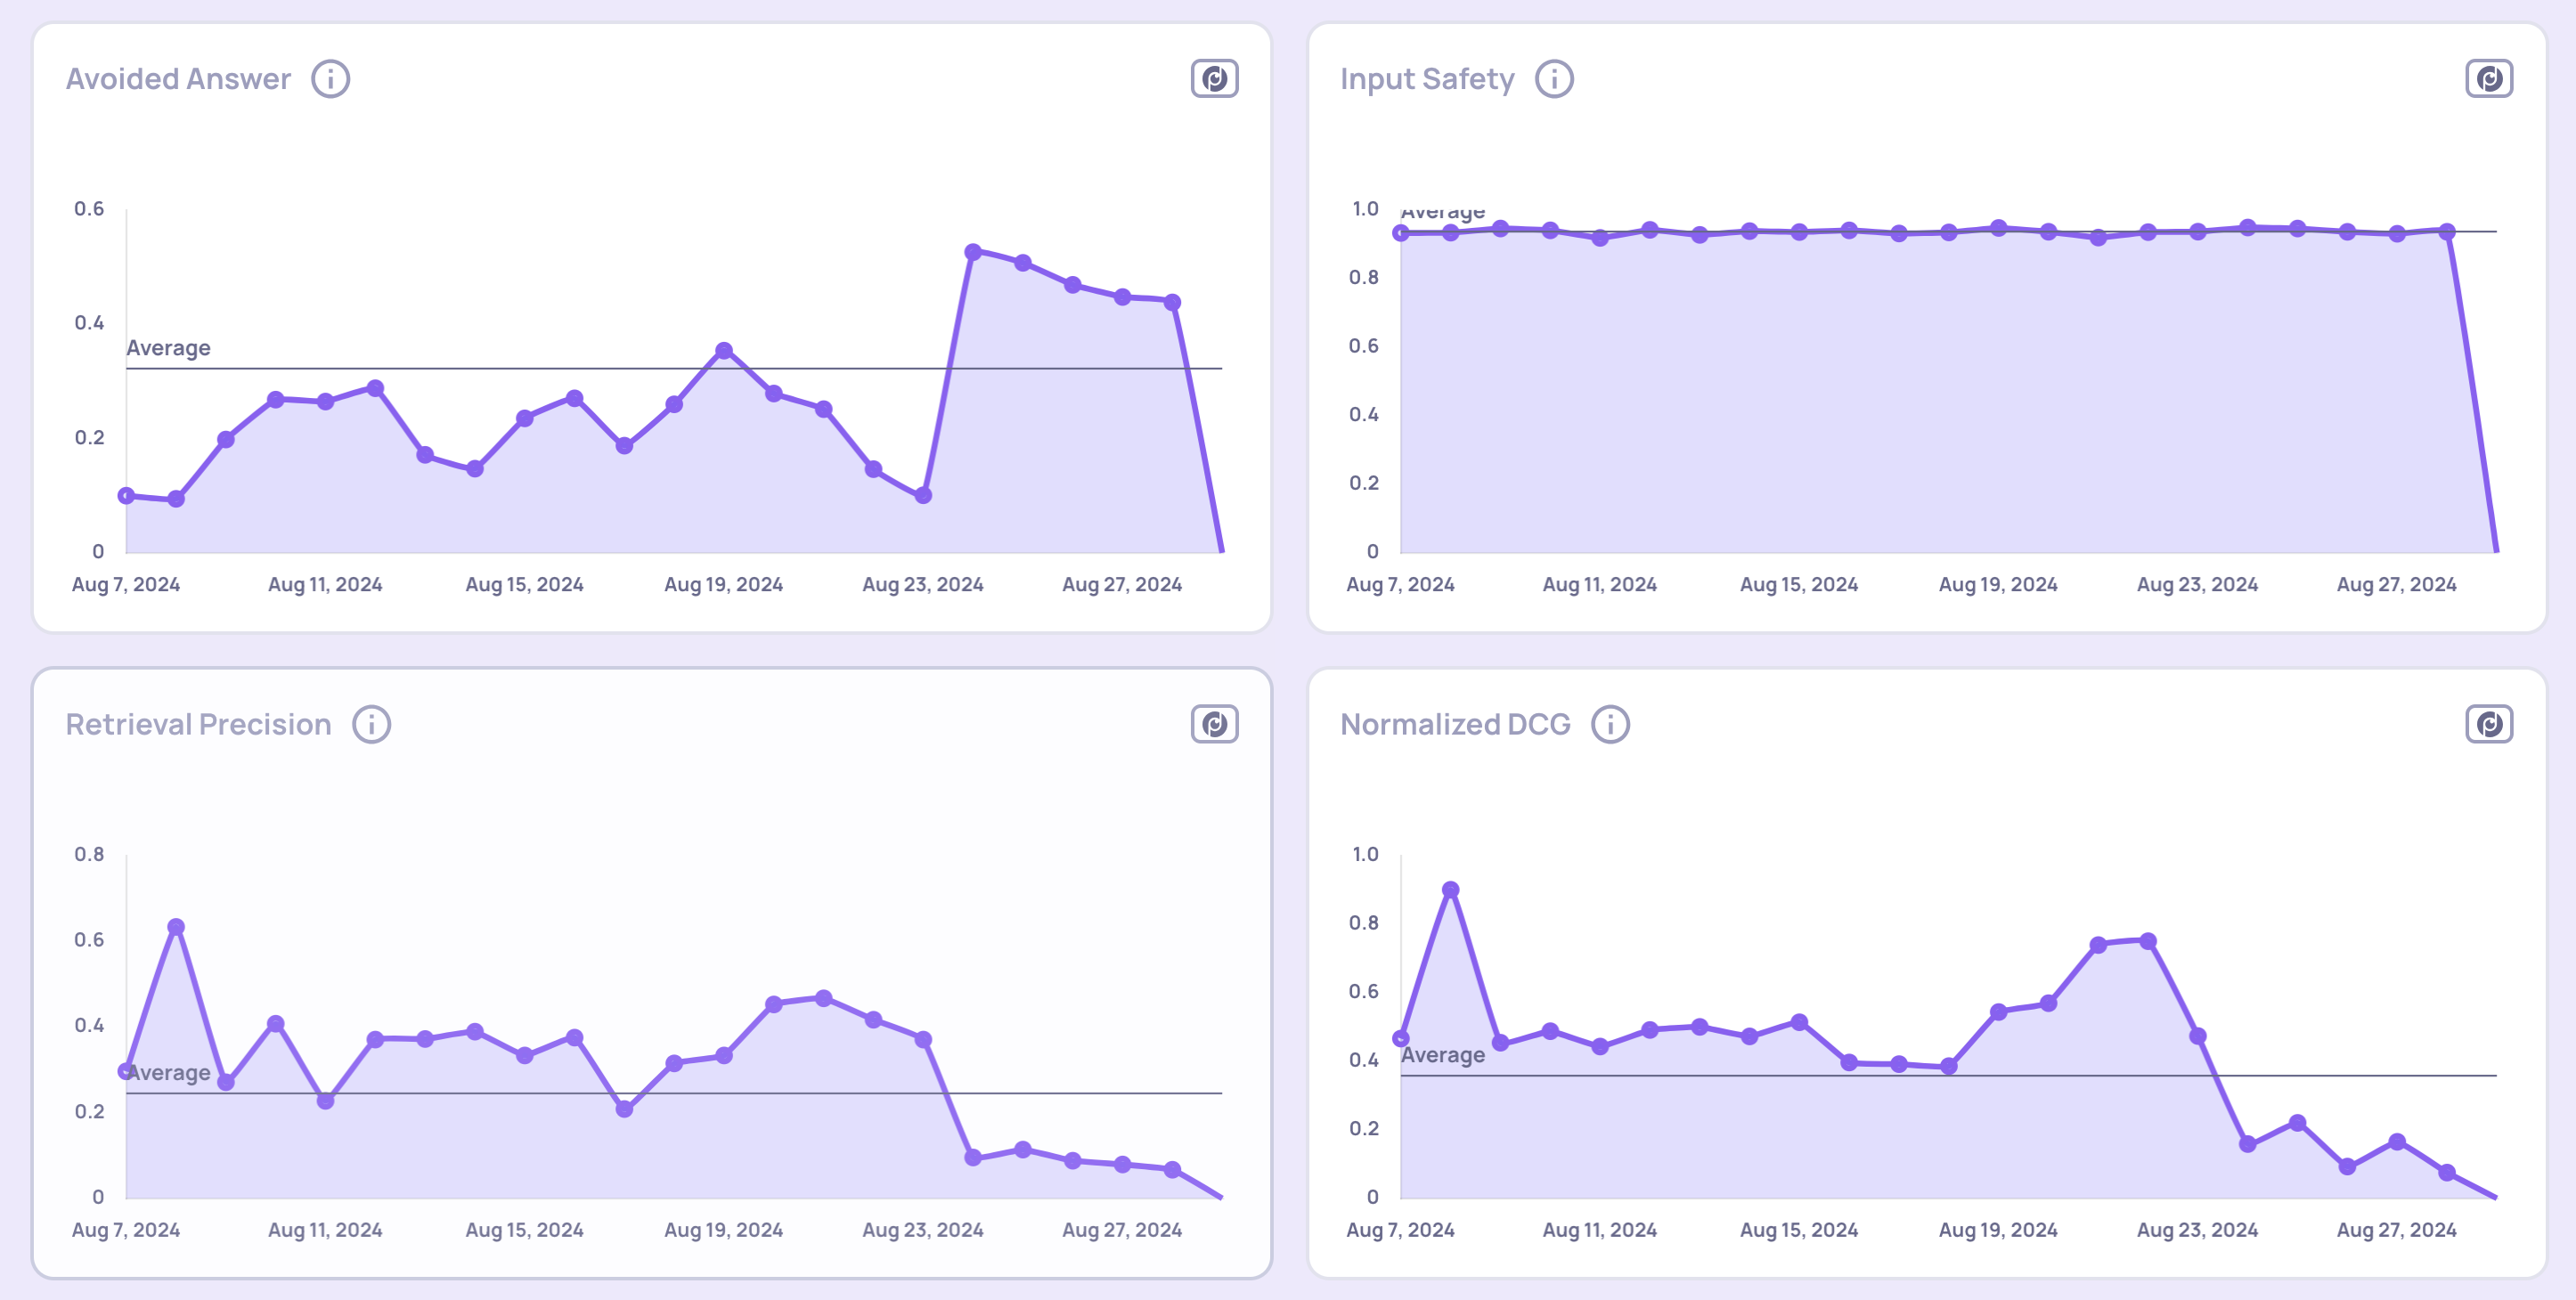
Property score trends view
This gives you a clearer, data-driven view into what’s driving performance.
Processing Status Indicators for Interactions & Sessions
Keep tabs on what’s done and what’s still running:
- In Progress: Analysis steps (property calculations, annotations, topic inference, similarity checks, etc.) are still underway.
- Completed: Everything’s finished, and results are ready.
Where to see it:
- Single Interaction View: Status icon at the top denotes real-time progress.
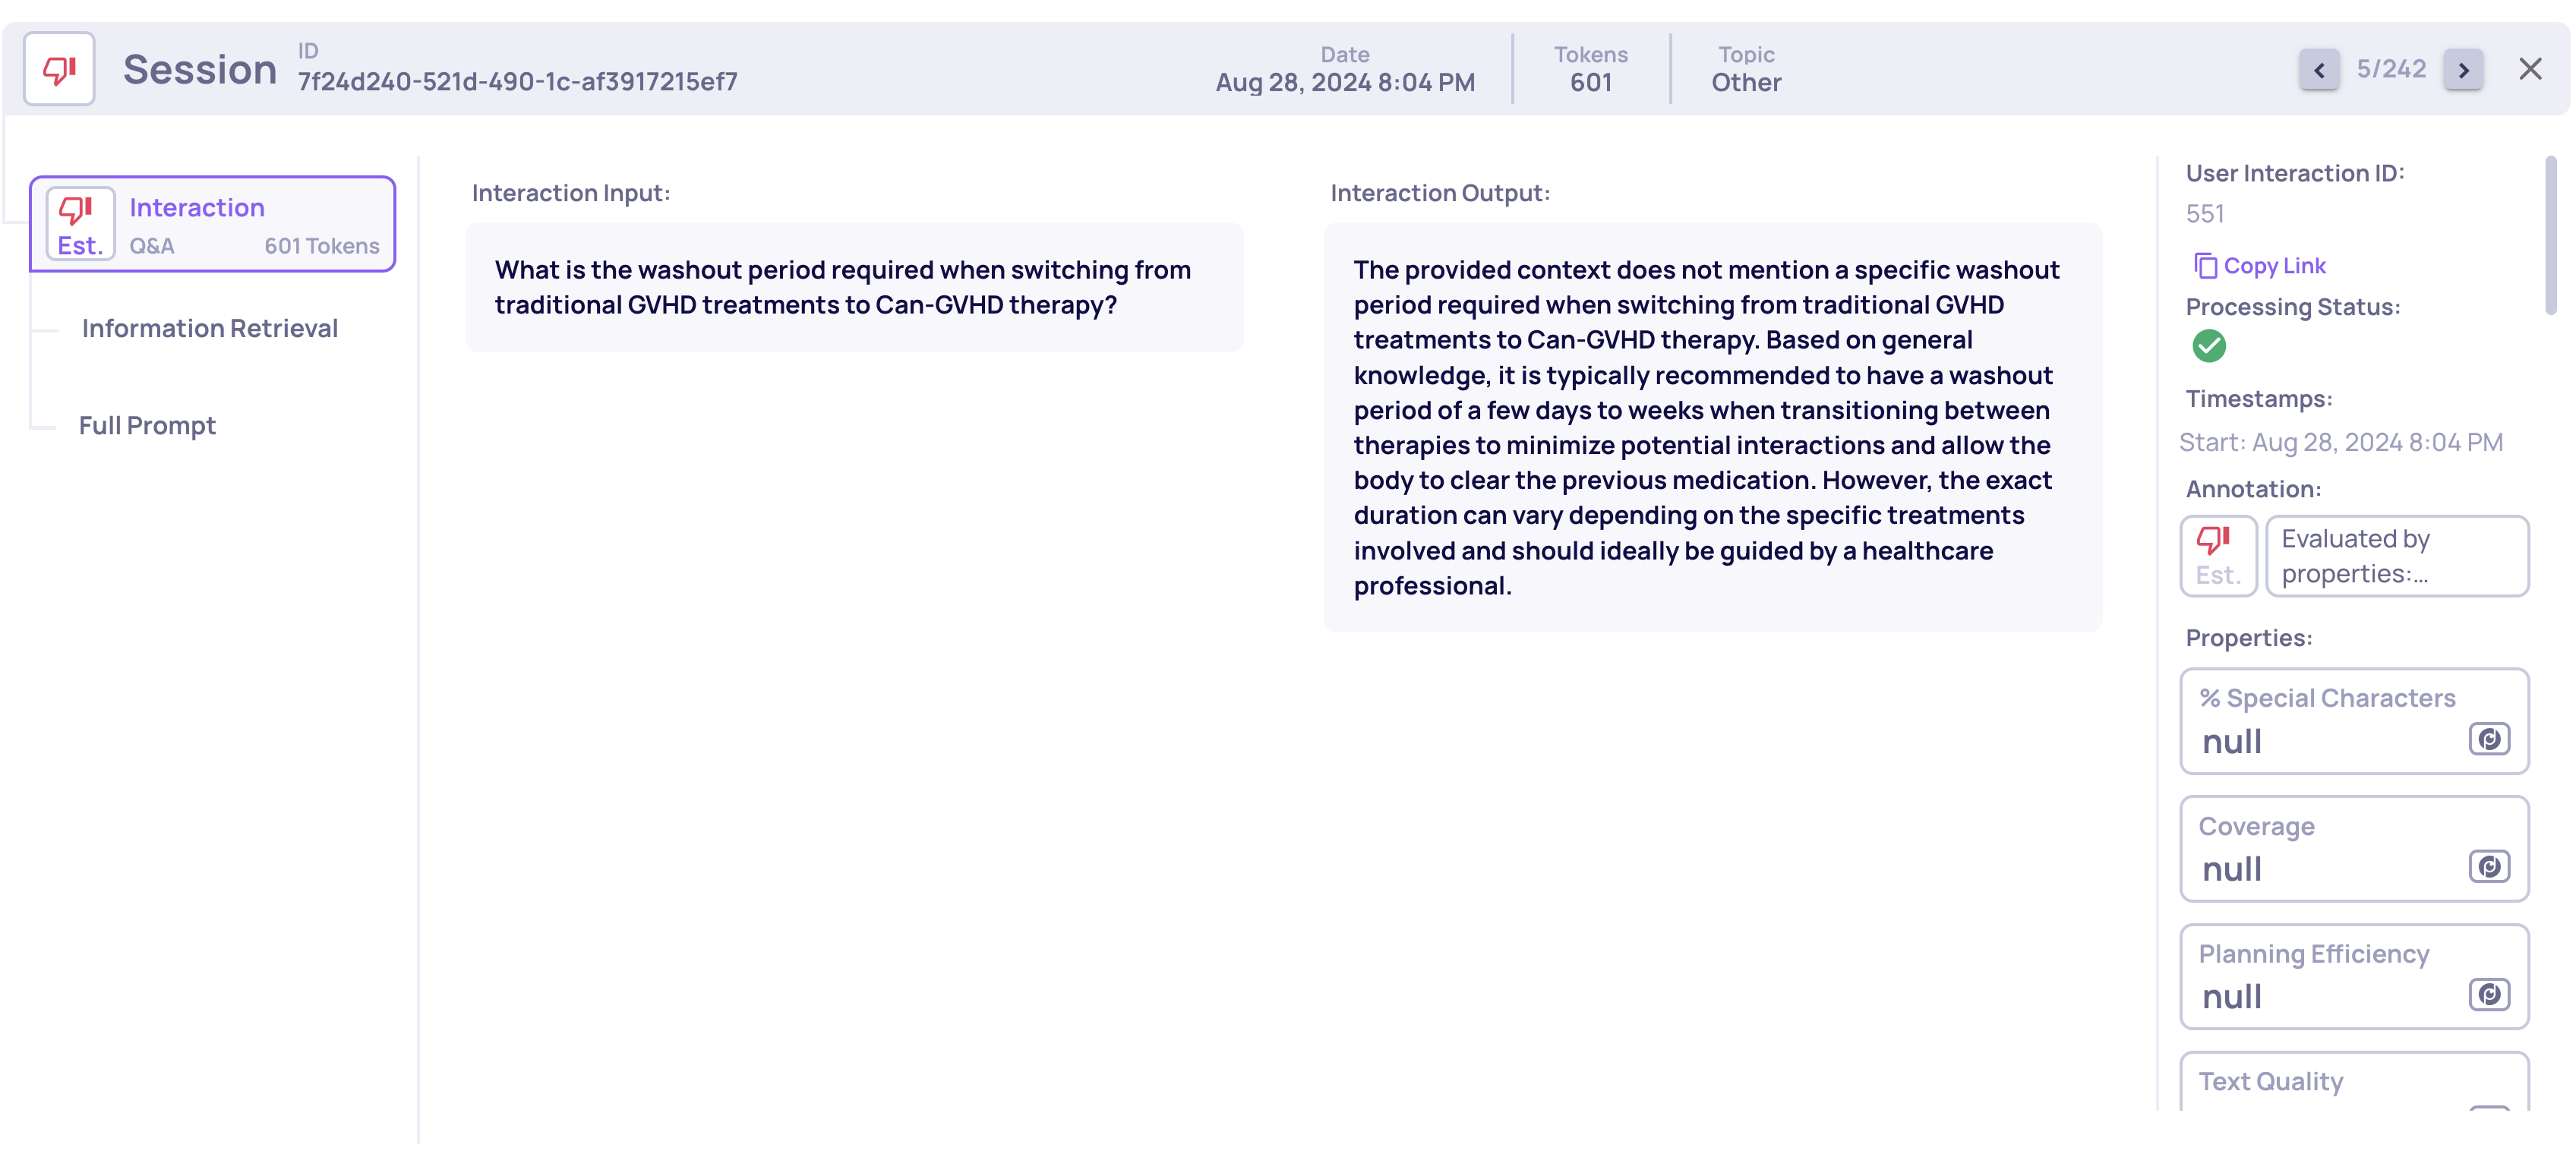
An interaction with a "completed" processing status (can be seen on the right of the screen)
- Interactions List: Each row shows an icon (with hover text) to quickly assess readiness.
- Sessions List: Each session displays a summary status—completed only when all interactions are done.
This way, you always know exactly what’s ready to review.
See more details here: https://llmdocs.deepchecks.com/docs/interaction-and-session-completion-status
Click-to-Filter from Score Breakdown
In the Score Breakdown component, now clicking any property or annotation reason instantly filters the Interactions screen to show only relevant items. It makes digging into causes intuitive and fast.
Reasoning for N/A Properties
When a property is marked N/A, you’ll now see a brief explanation—why it couldn’t be calculated. Over the next few weeks, this reasoning will be extended to cover more property types, offering transparency and aiding debugging.
Hyperlinked Examples in Failure Mode Analysis
Failure Mode Analysis now outputs interactive examples - every example includes a hyperlink that opens the specific interaction in a new window. This makes deep-dives from summaries directly actionable.
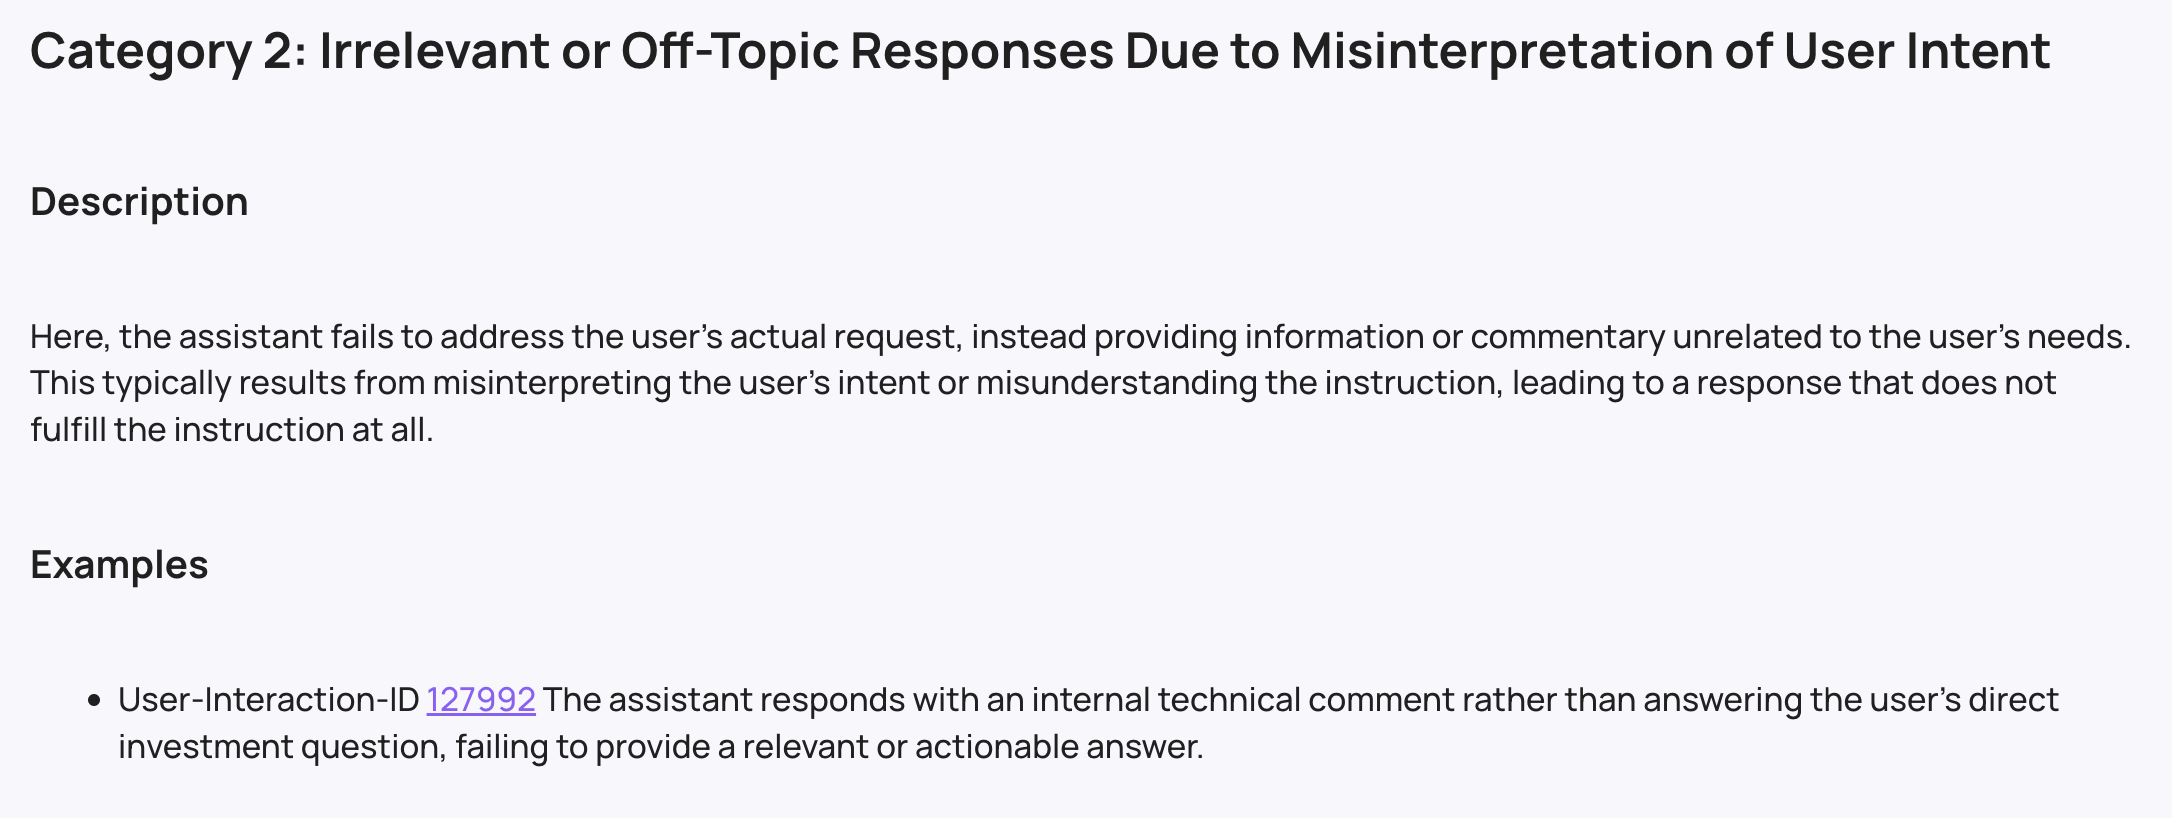
Failure mode analysis example with a hyperlink to the interaction