Production Monitoring
After customizing Deepchecks for a given LLM-based app, utilize the artifacts created to continuously monitor both quality and risk metrics in production
Production monitoring is an important capability for any software application. In the context of an LLM app, it’s both more important and more challenging than the “average” software application: The solution’s quality has many “fluctuations”, there are use cases that aren’t handled well that can become more common, and there is the possibility of changes related either to LLM APIs or the internal accompanying code and guardrails. And clearly, monitoring raw text is a challenging task.
Using Deepchecks for Production Monitoring
To utilize Deepchecks to assist with this workflow, it is recommended to follow these steps:
- Build & annotate a golden set that is as representative as possible of the production data.
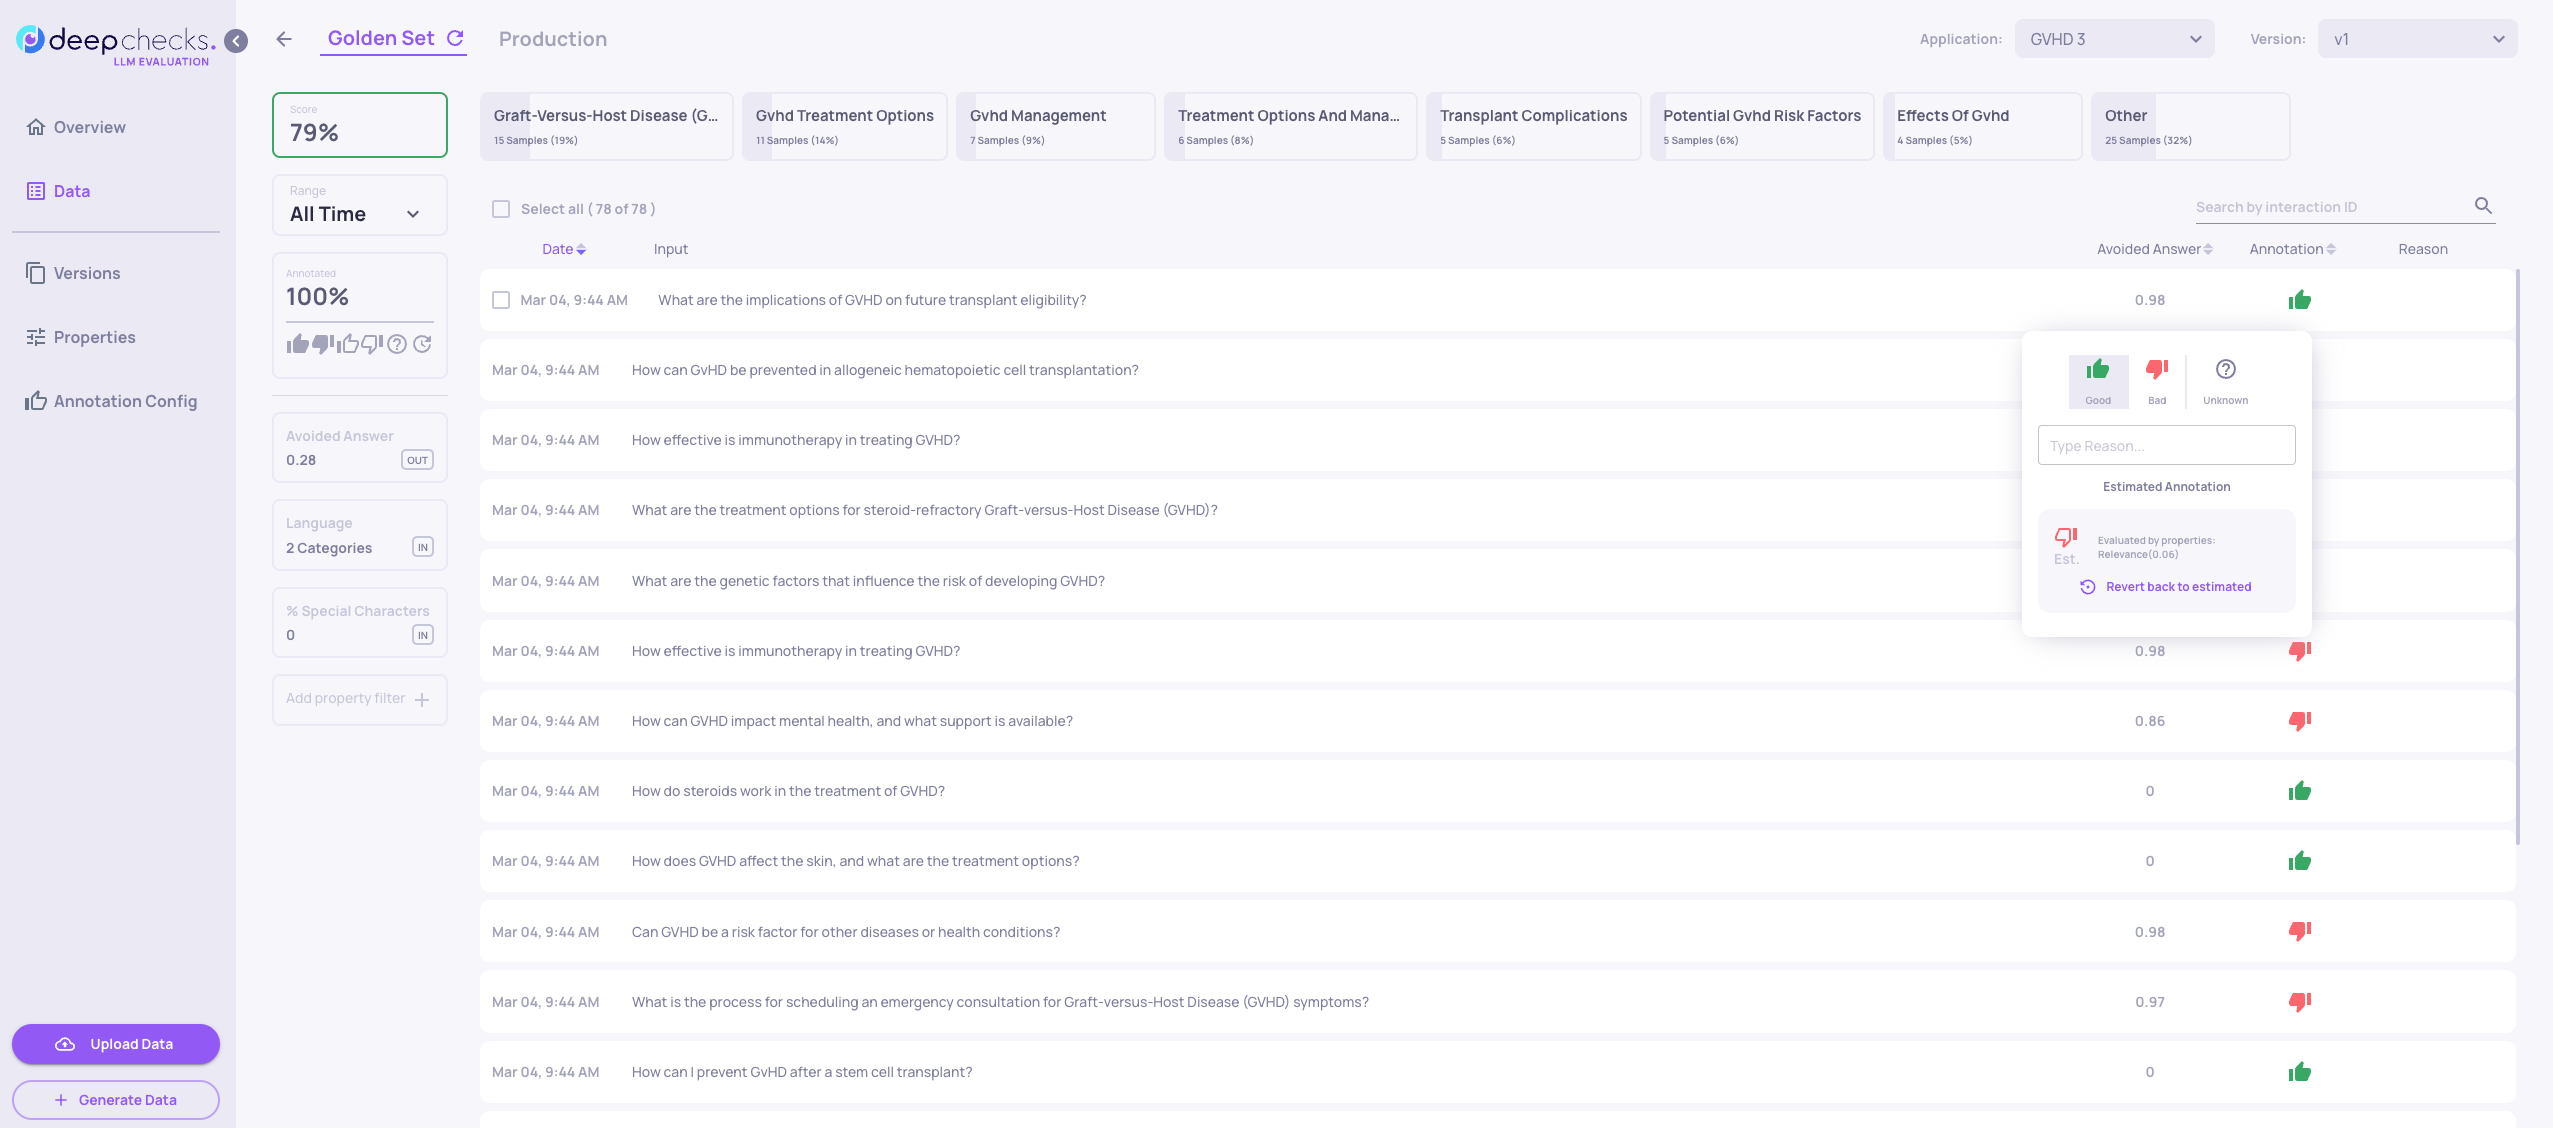
- Add and improve custom properties within the Deepchecks system that provide important information relevant to the specific use case. These can be either custom properties calculated earlier than “the Deepchecks stage” in the pipeline, or LLM properties created within Deepchecks.
- Try multiple configurations of the auto-annotation pipeline, by updating the config YAML file within the system. The YAML should utilize the most informative custom properties created as part of the previous stage. Choose the version that has the best combination of prediction accuracy, and alignment with acceptable business logic.
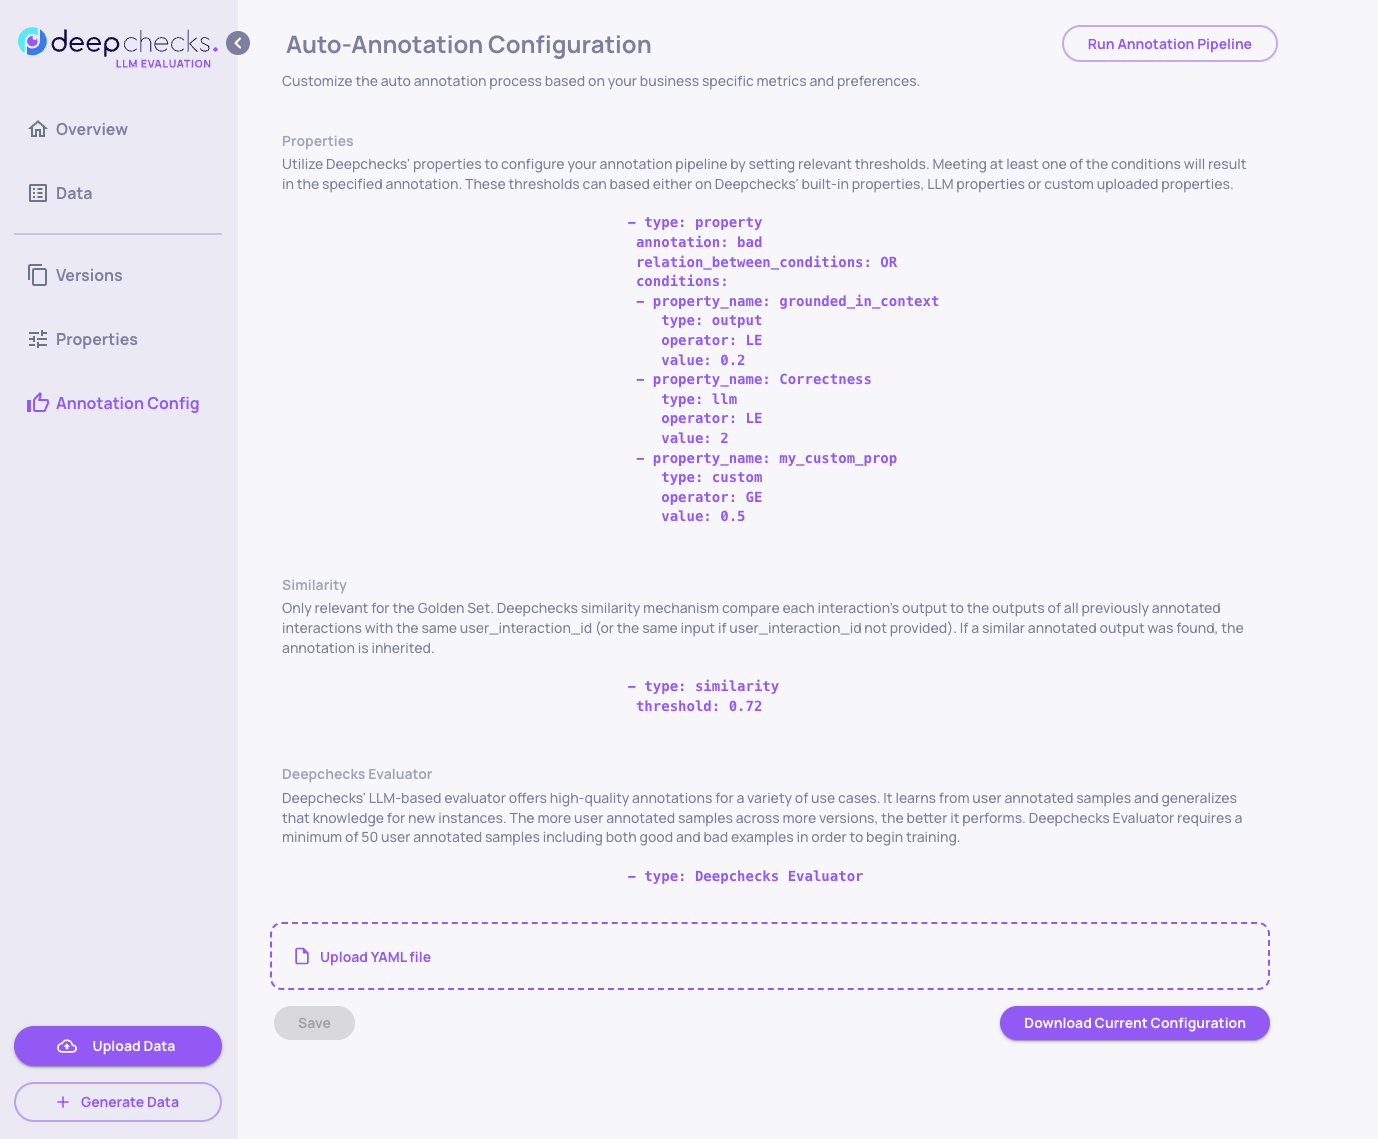
Editing the YAML file takes place within the "Annotation Config" tab.
- Periodically send data from each interaction to an APM such as Datadog, New Relic, etc. using Deepchecks’ SDK. Data should include the “estimated annotations”, leading properties, and for APMs that enable it – also the raw textual data. Here is a minimal example of sending data to New Relic (for other APMs, see integrations section):
from deepchecks_llm_client.client import dc_client
from deepchecks_llm_client.data_types import EnvType
from newrelic_event_publisher import NewRelicEventHandler
import os
import dotenv

EVENT_NAME = 'DEEPCHECKS_LLM_EVALUATION'

if __name__ == "__main__":
    dotenv.load_dotenv(override=True)

    app_name = os.getenv('APP_NAME', 'observability_demo')
    version_name = os.getenv('APP_VERSION', '1')

    dc_client.init(
        host=os.getenv('HOST', 'https://app.llm.deepchecks.com'),
        api_token=os.getenv('API_TOKEN', '<YOUR_API_TOKEN>'),
        app_name=app_name,
        version_name=version_name,
        env_type=EnvType.EVAL,
        auto_collect=False)

    df = dc_client.get_data(
        EnvType.EVAL,
        version_name,
        return_topics=True,
        return_output_props=True,
        return_annotation_data=True
    )
    df['annotation'] = df['annotation'].fillna("unknown")

    if os.getenv('NR_API_KEY'):
        nr_handler = NewRelicEventHandler()
nr_handler.post_event(EVENT_NAME, df)- Configure dashboards, segments and alerts within the APM. See for example a monitoring dashboard within New Relic (following the previous example), that is based upon Deepchecks-created properties and annotations:
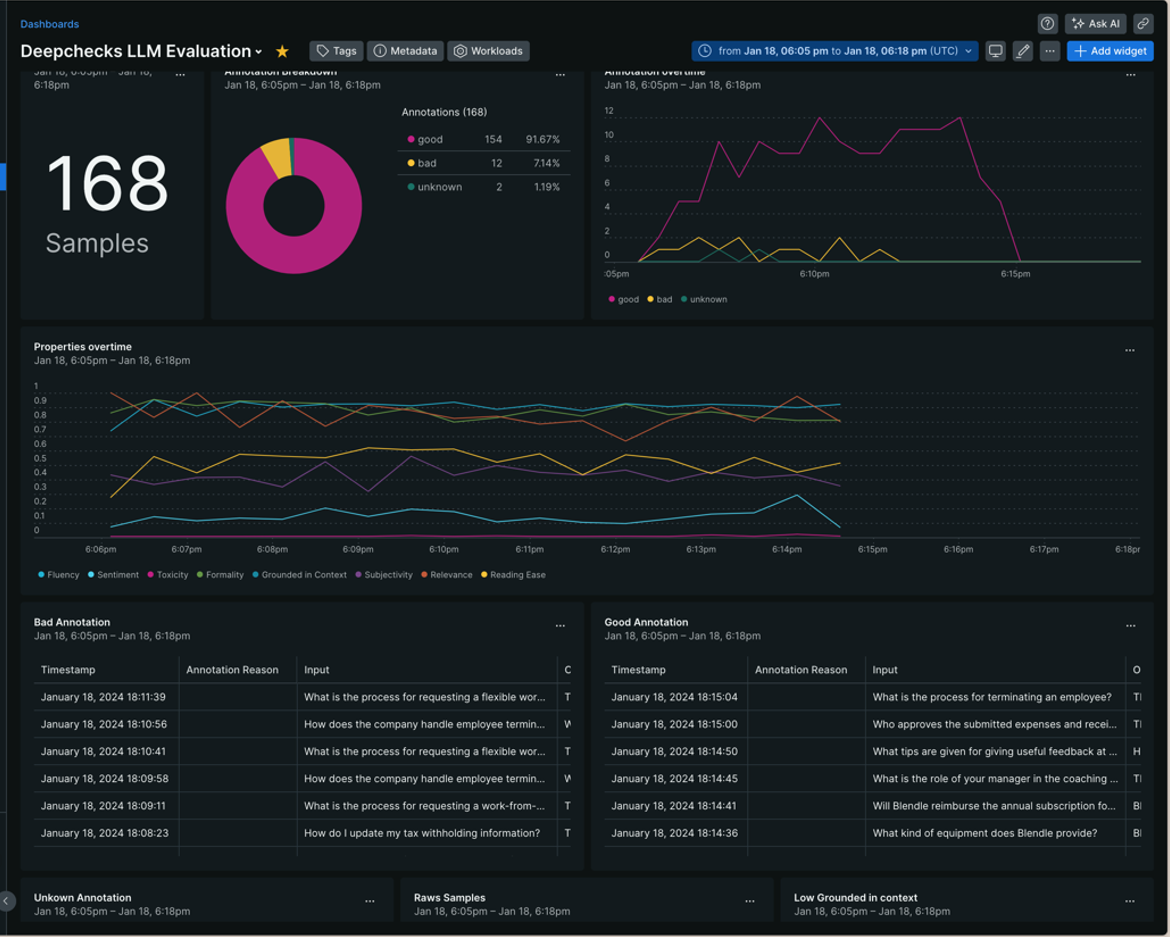
Monitoring dashboard within New Relic, that is based upon Deepchecks-created properties and annotations
- Interactions that are ingested by Deepchecks will also appear in the "Production" tab, enabling a deeper drill down regarding samples that need further investigation after the APM workflow.
Updated 6 months ago