0.45.0 Release Notes
by Yaron FriedmanDeepchecks LLM Evaluation 0.45.0 Release
Version 0.45 brings a unified navigation overhaul, session-level properties, multi-turn data generation with personas, and a wave of customer-driven enhancements across SDK, self-hosted deployments, and evaluation quality.
Deepchecks LLM Evaluation 0.45.0 Release:
🧭 Navigation & Information Architecture Overhaul
🤖 Multi-Turn Data Generation with Personas
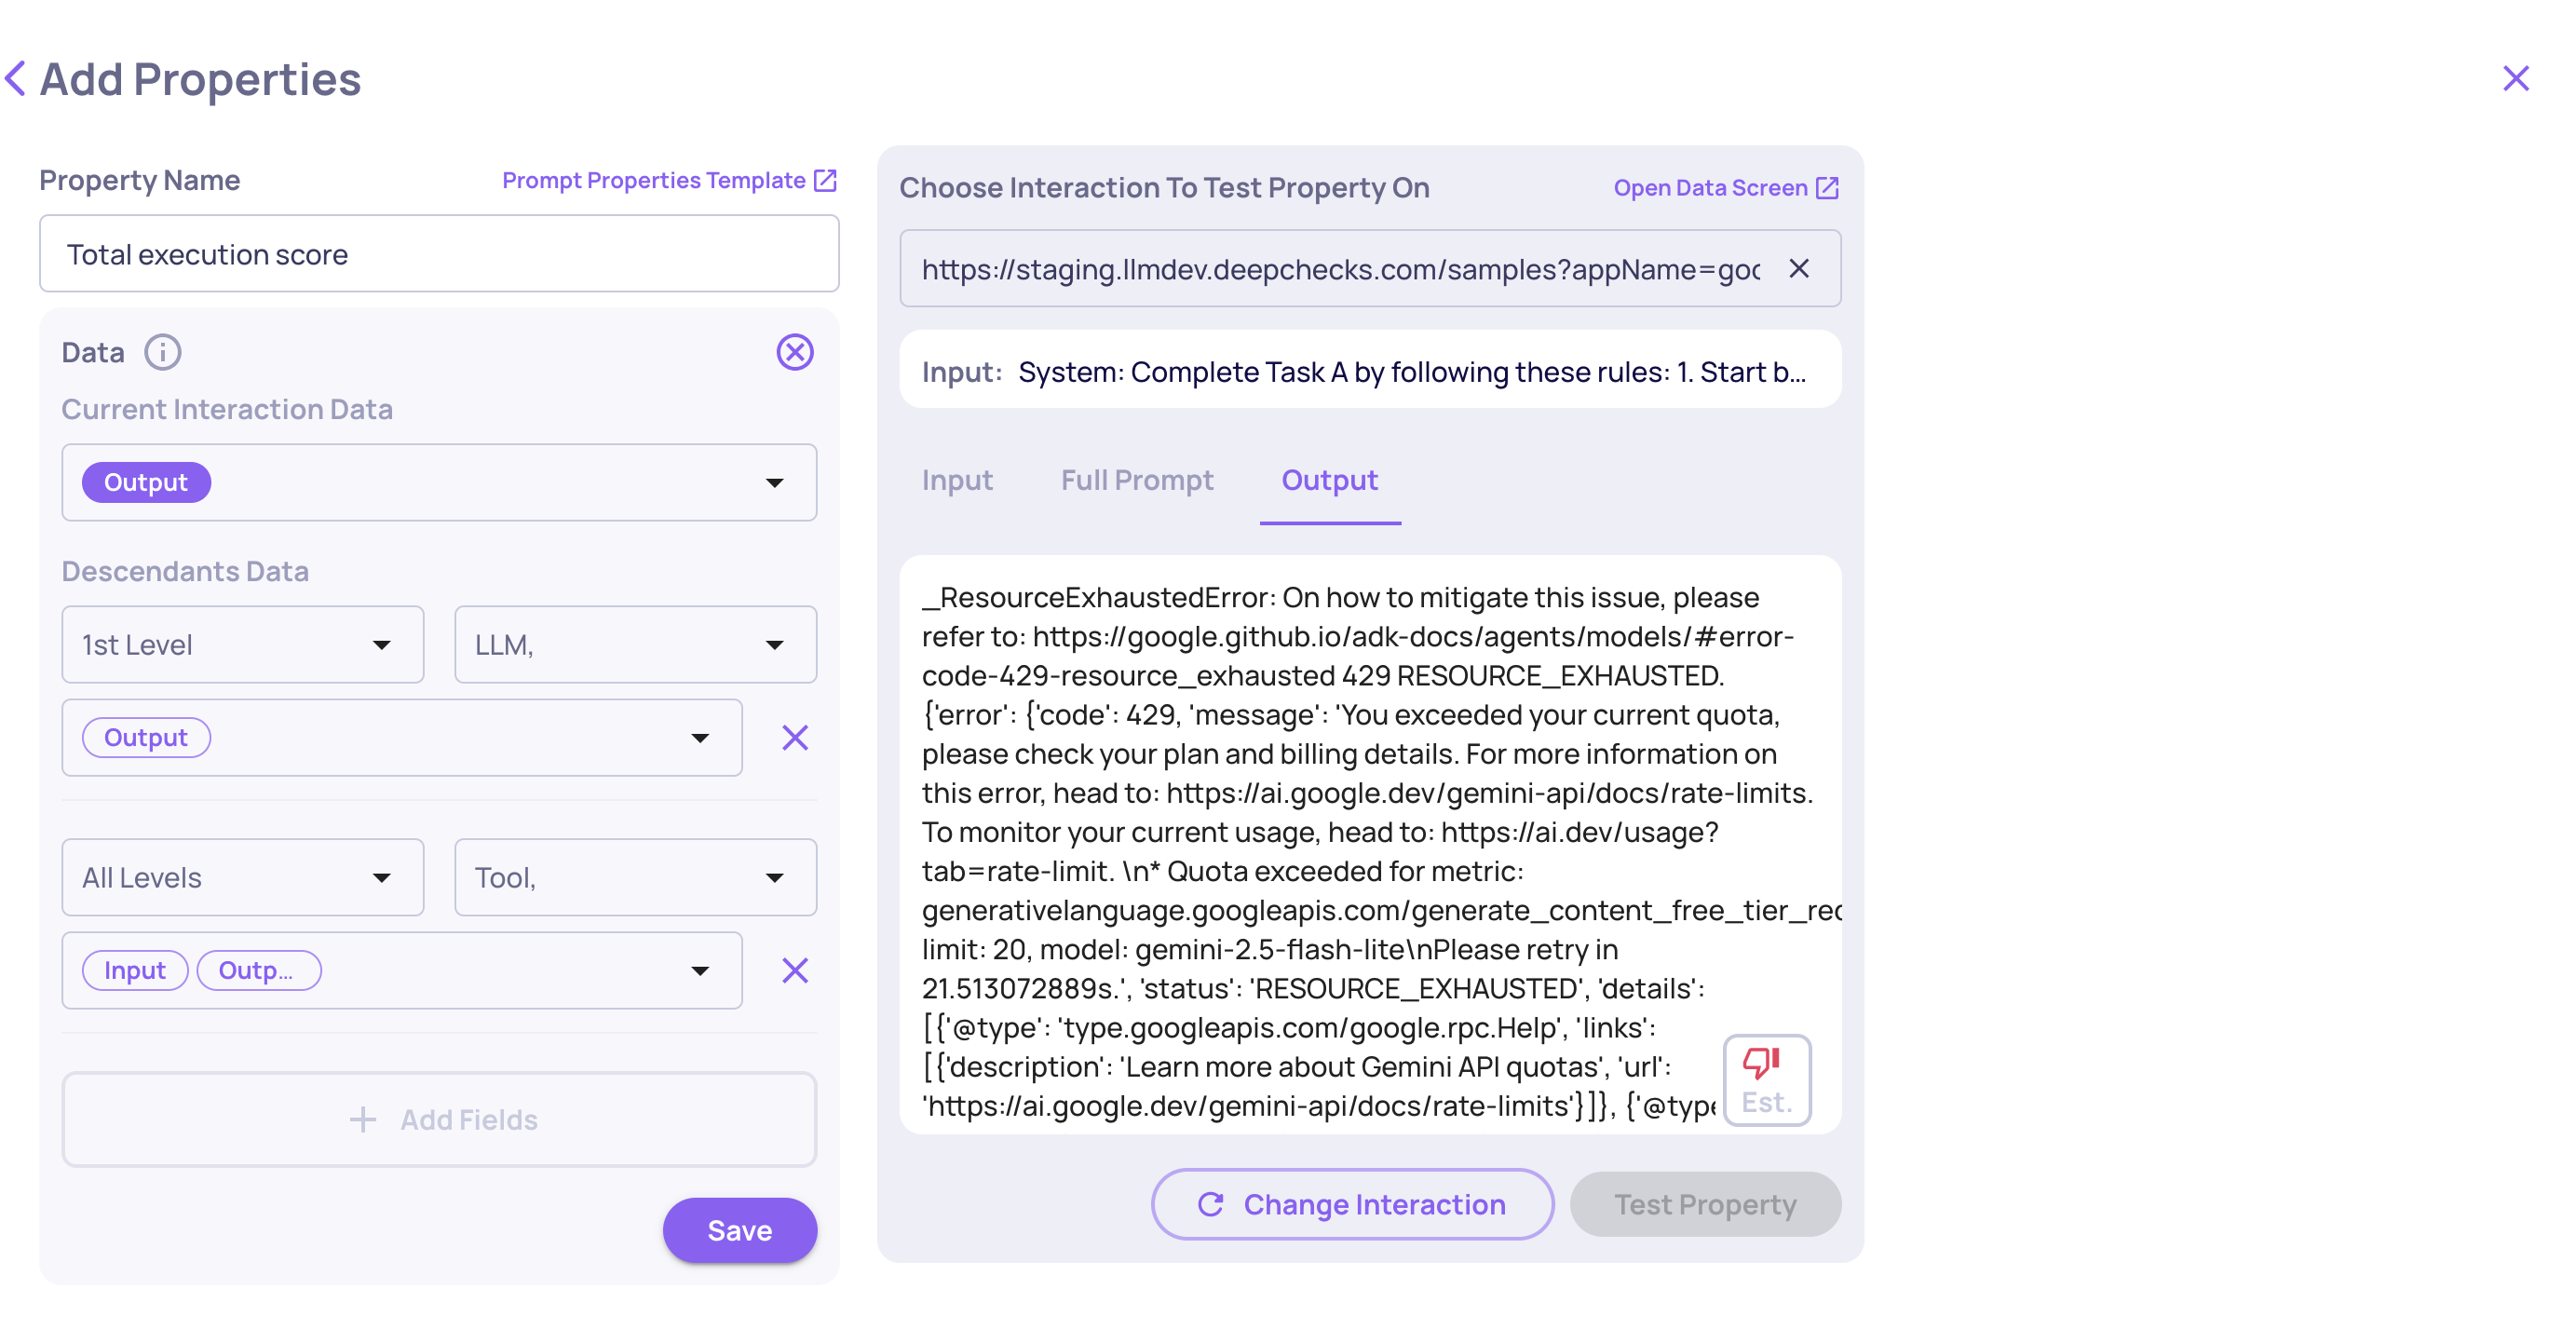
🎯 GIC New Scoring System
🕓 Manual Annotation History
🆕 Response Type Built-In Property
🧰 Tool Abuse & Error Detection in HPI
🛠️ SDK: App & Workspace Configuration
🔑 API Keys & Service Tokens Overhaul
📥 Granular Per-Call Usage CSV
🚦 Owner-Configurable LLM Usage Limits (Self-Hosted)
📖 New SDK Reference Docs
🪟 Persistent Interaction-View Layout
What's New and Improved?
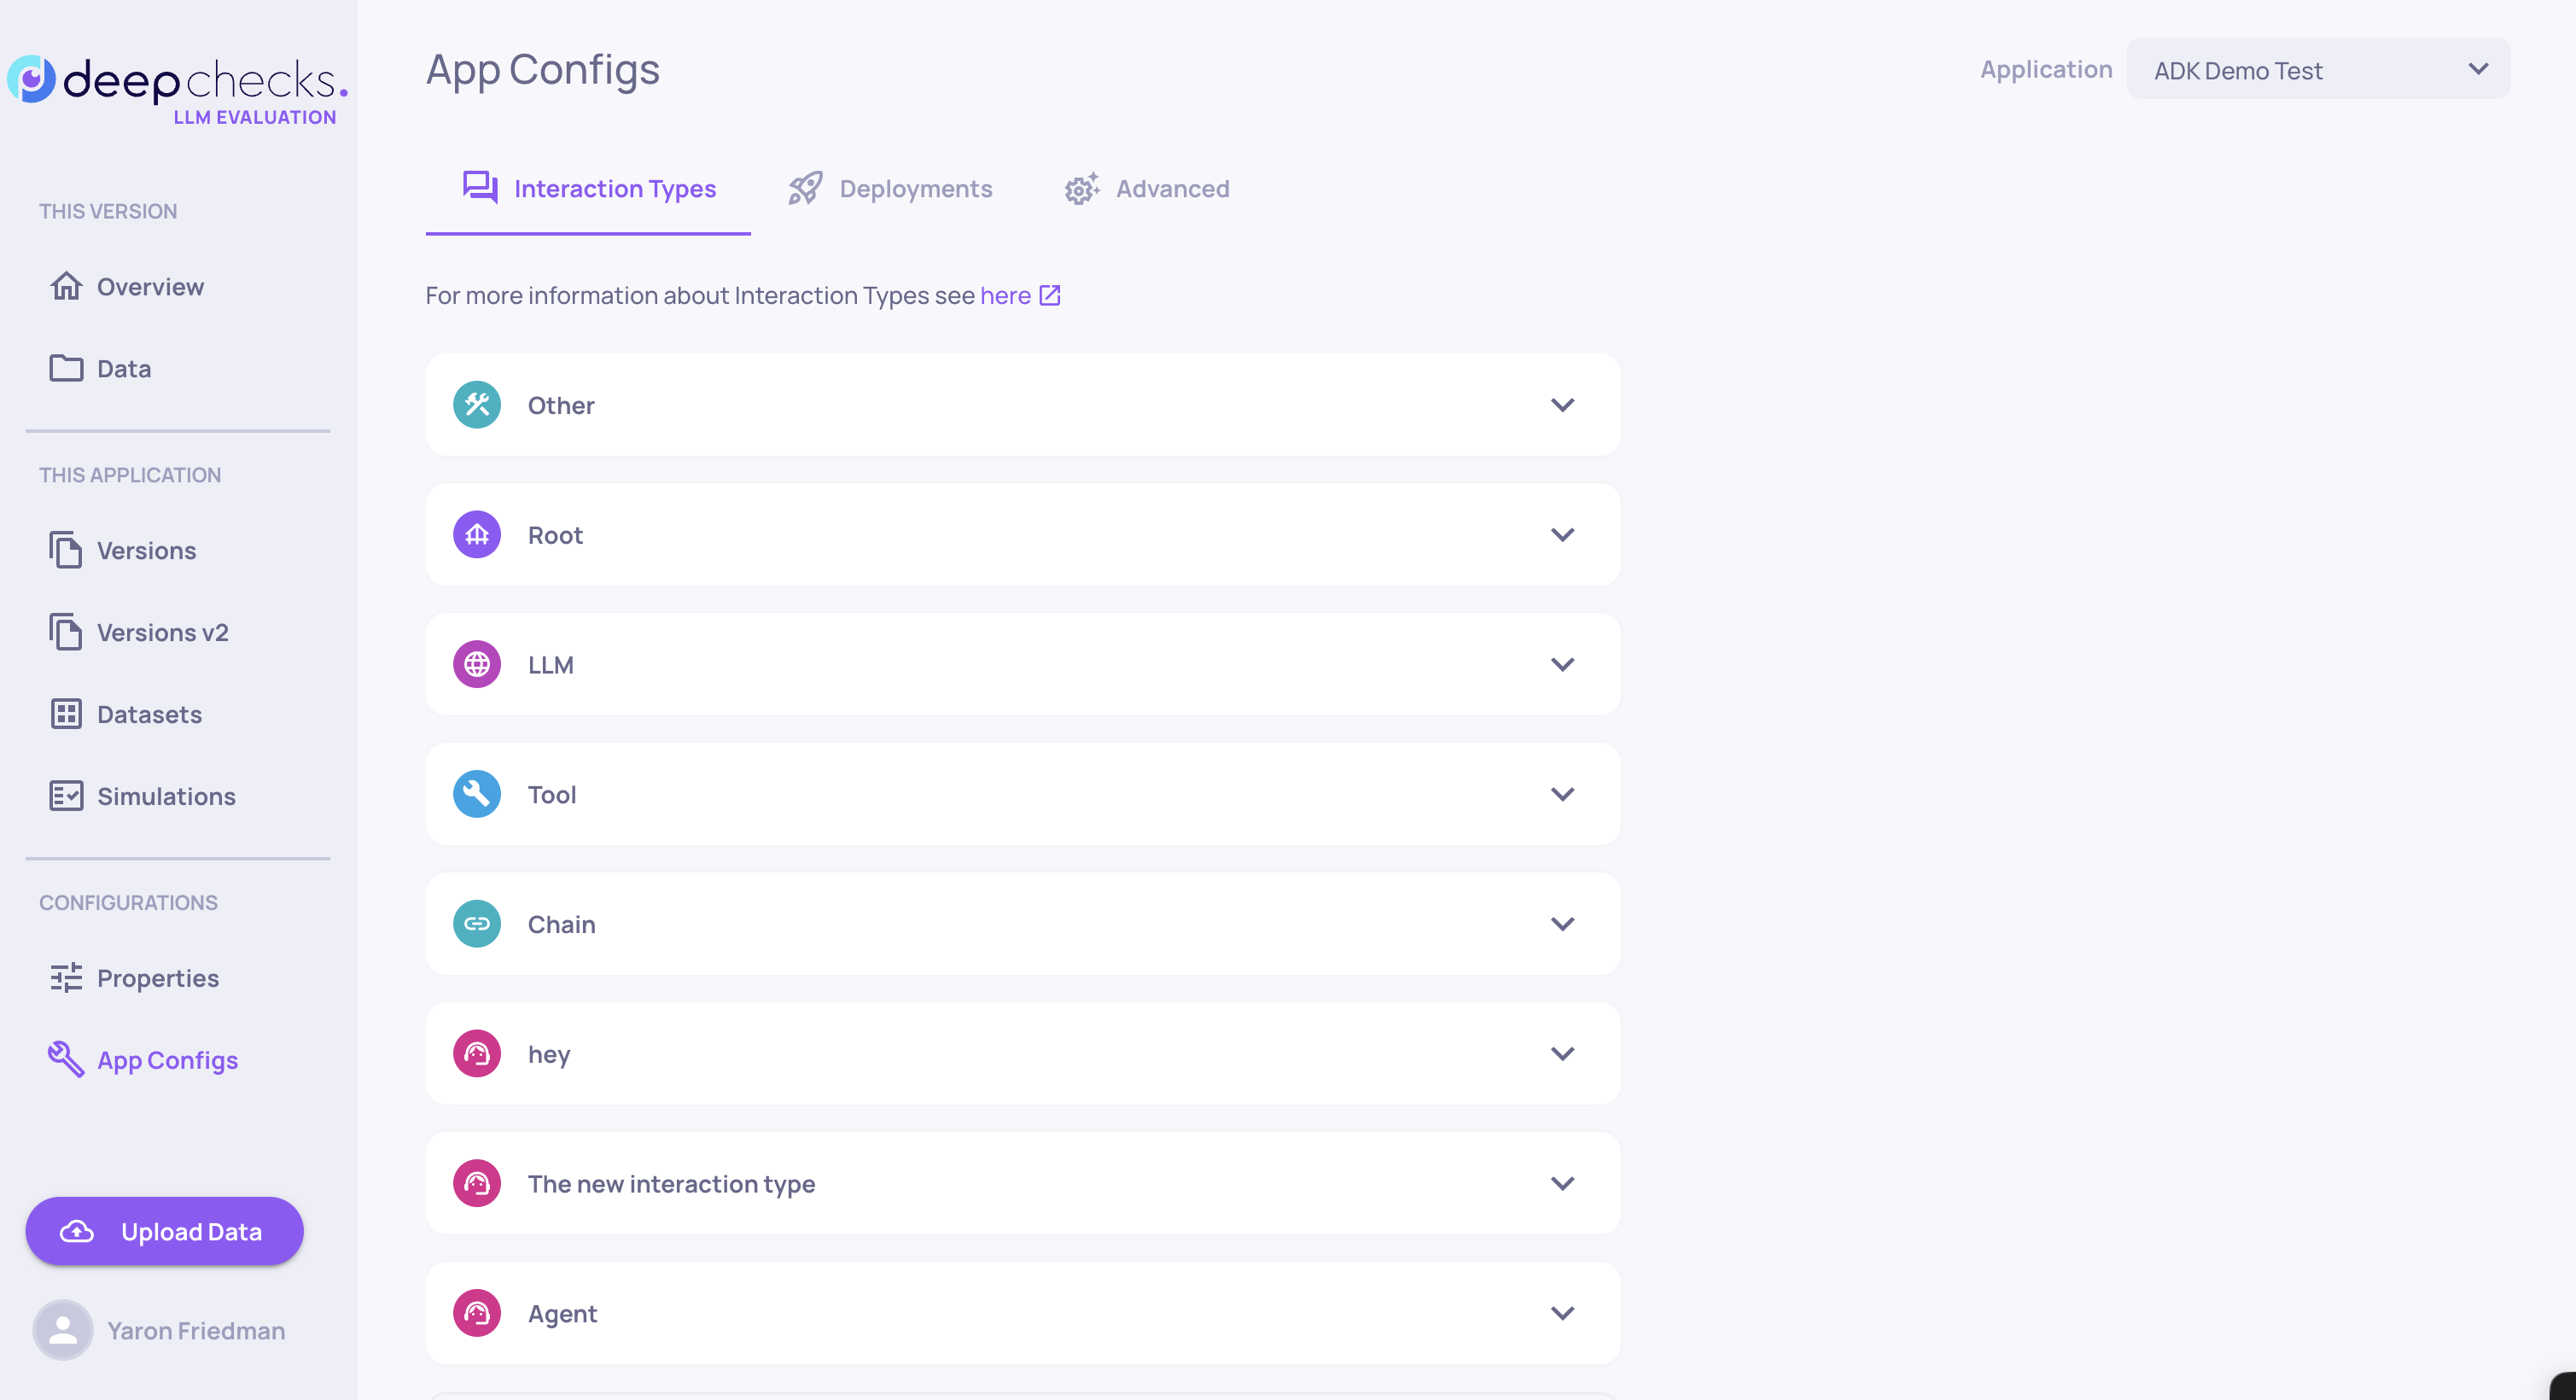
🧭 Navigation & Information Architecture Overhaul
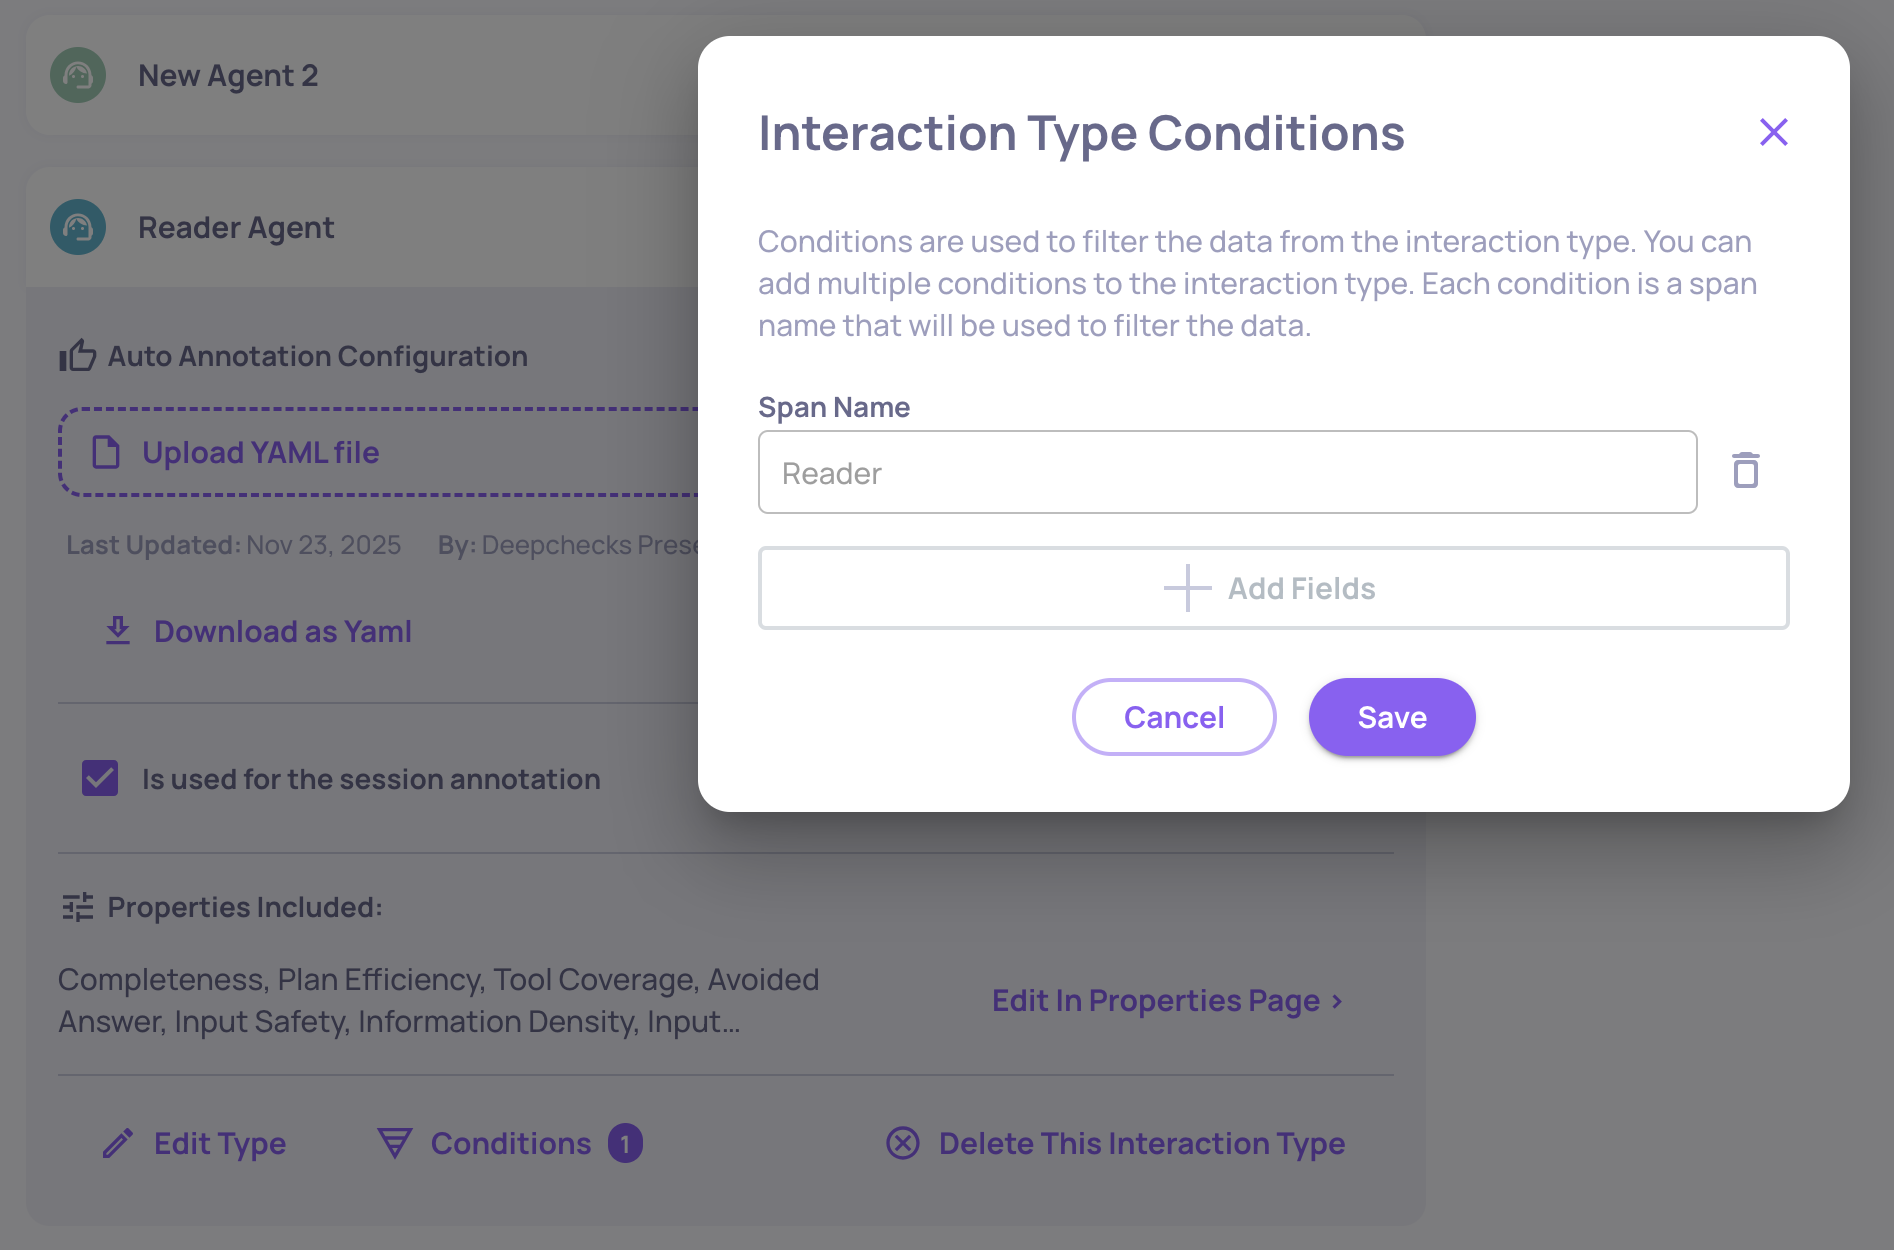
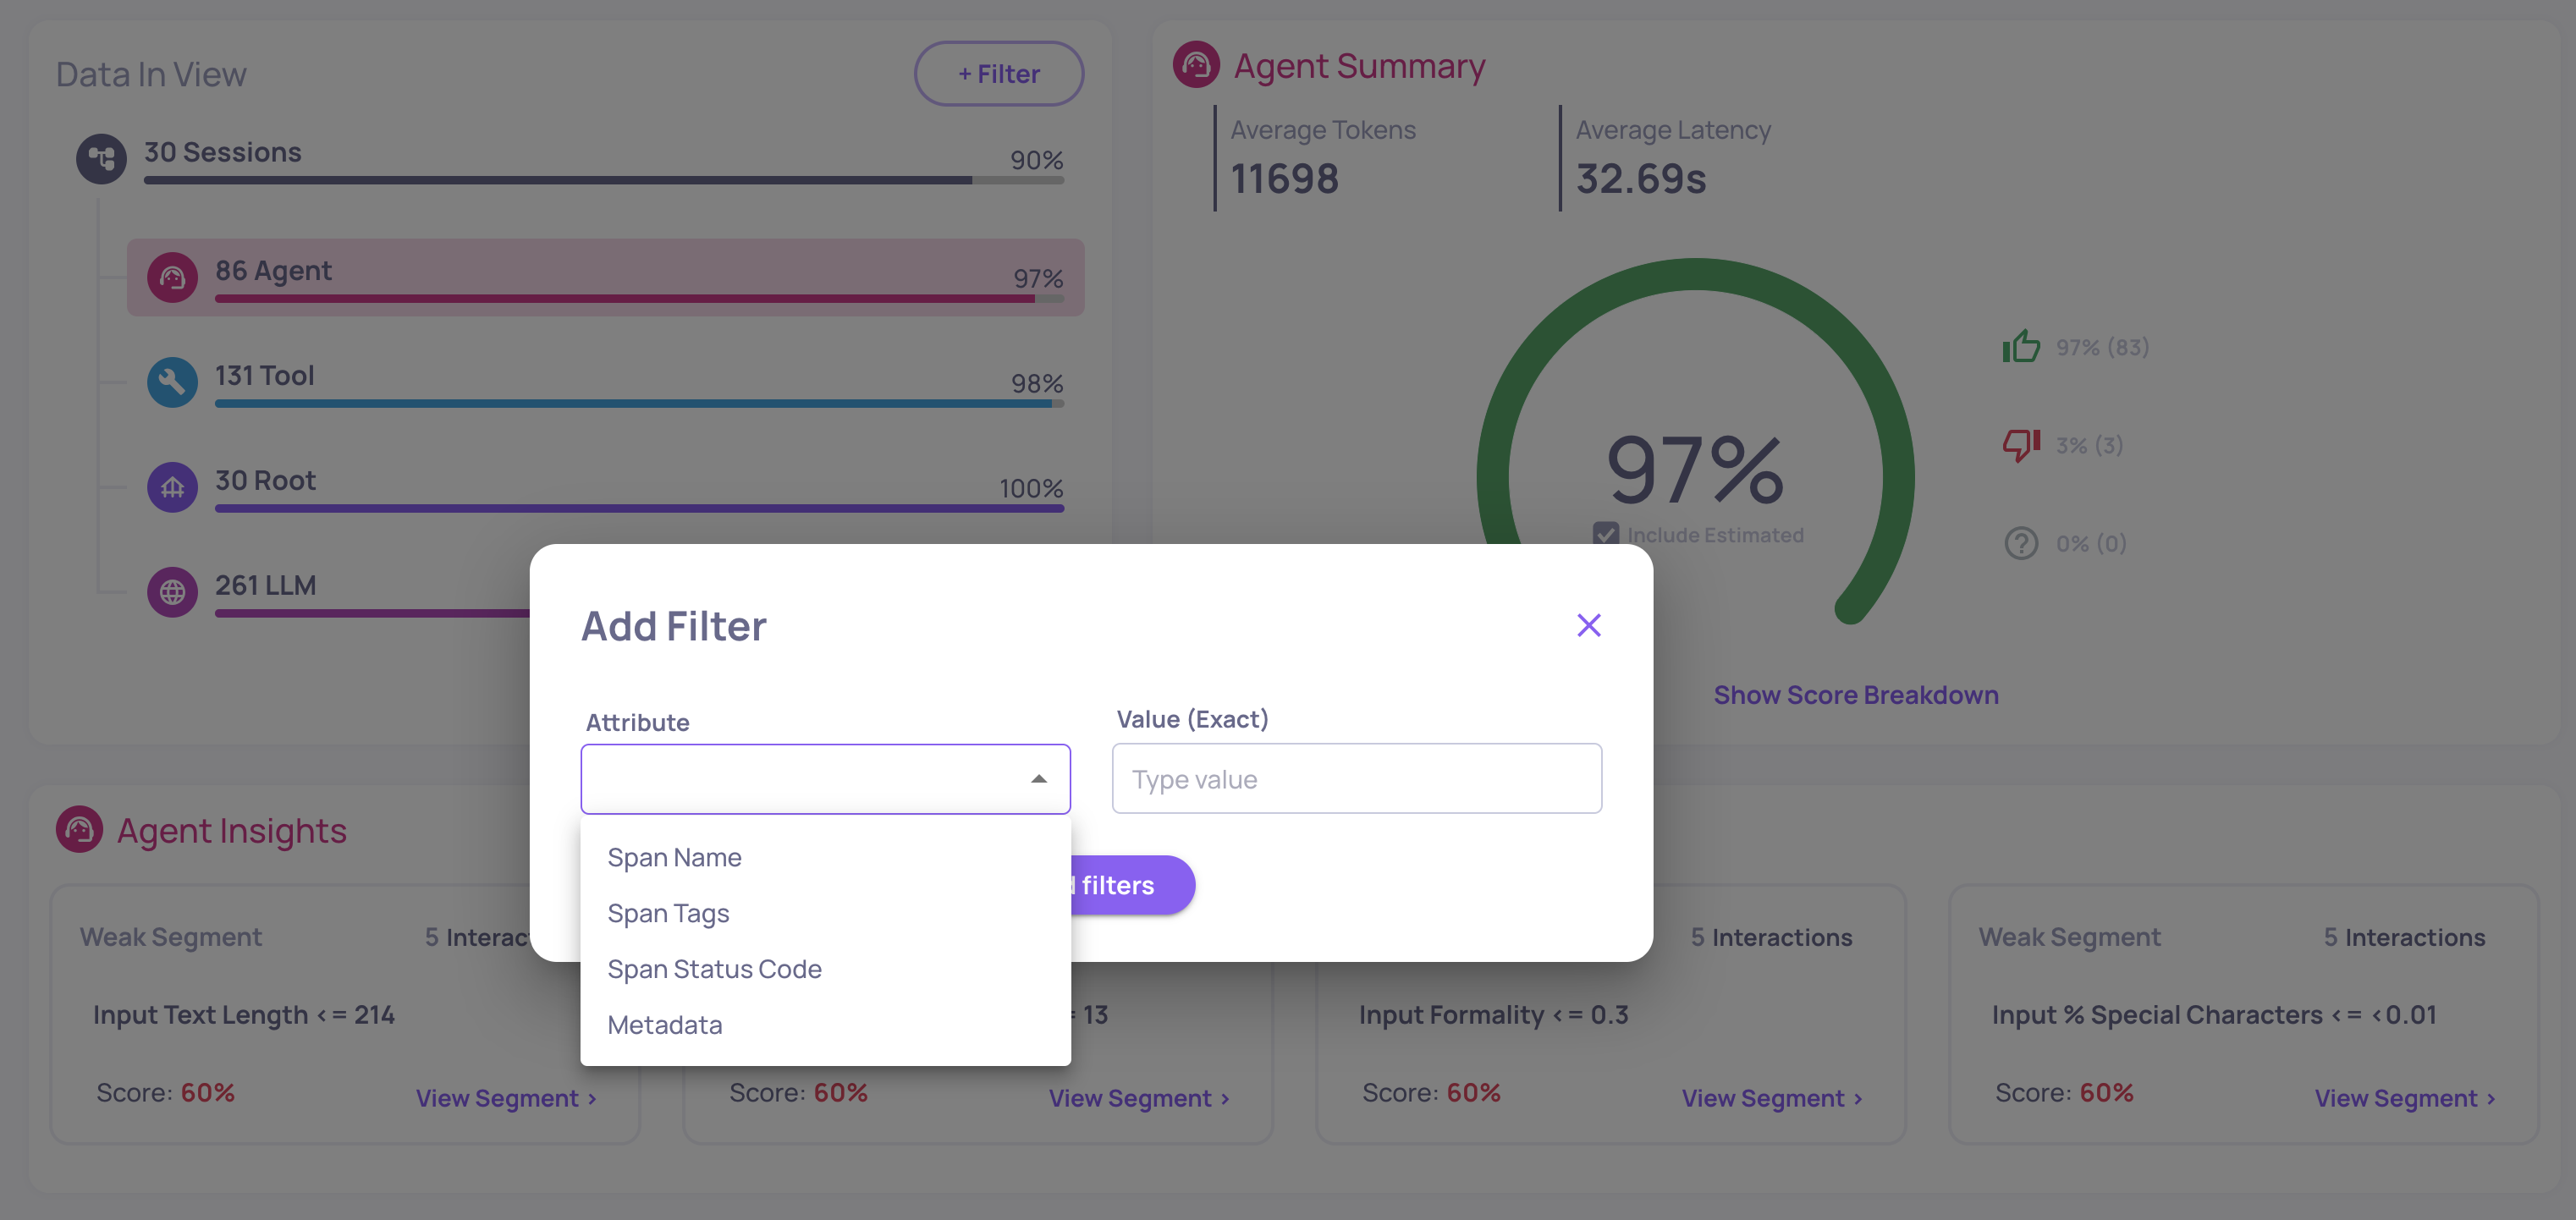
The platform's information architecture has been substantially rethought to make day-to-day work faster and clearer. Interactions, Sessions, and Storage are now unified into a single tabbed Data page, so you can move between related views without losing context. The previous Interaction Types screen has been replaced by a new App Configs screen that brings all app-level configuration into one tabbed interface. The sidebar has been reorganized with section dividers and titles, contextual docs links now live at the top of every main page, and the EVAL environment no longer carries the time-range picker.
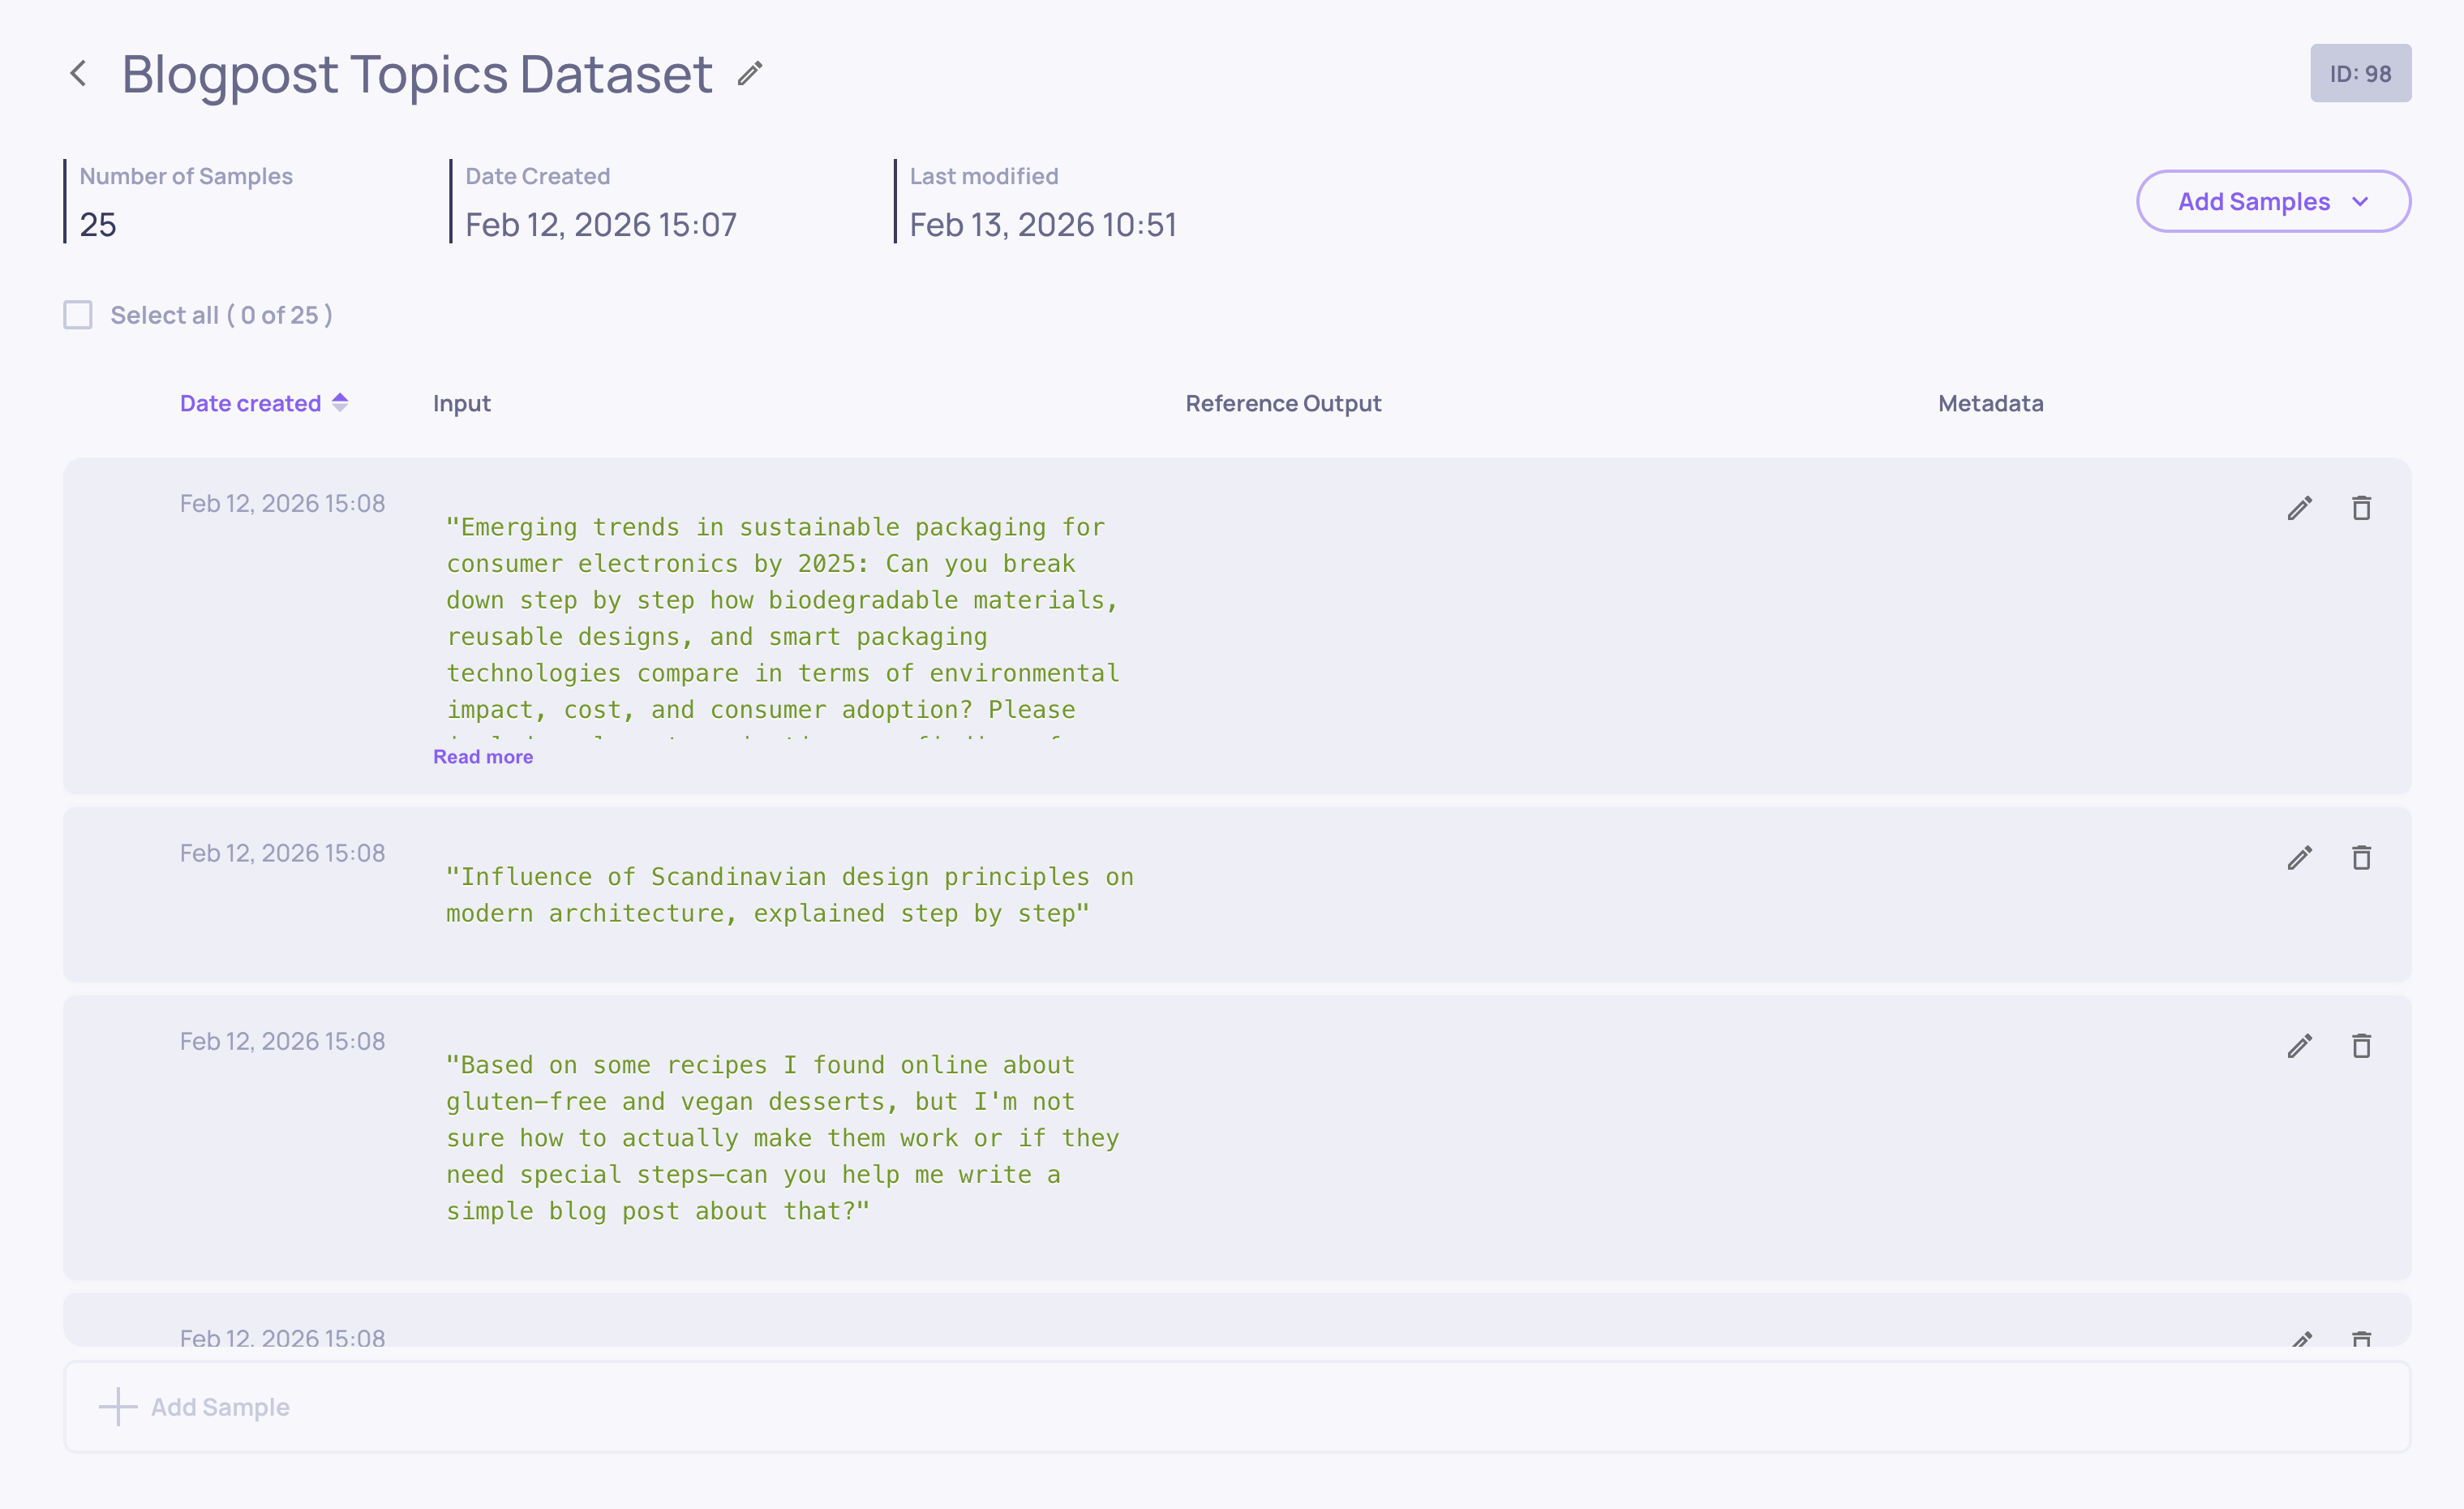
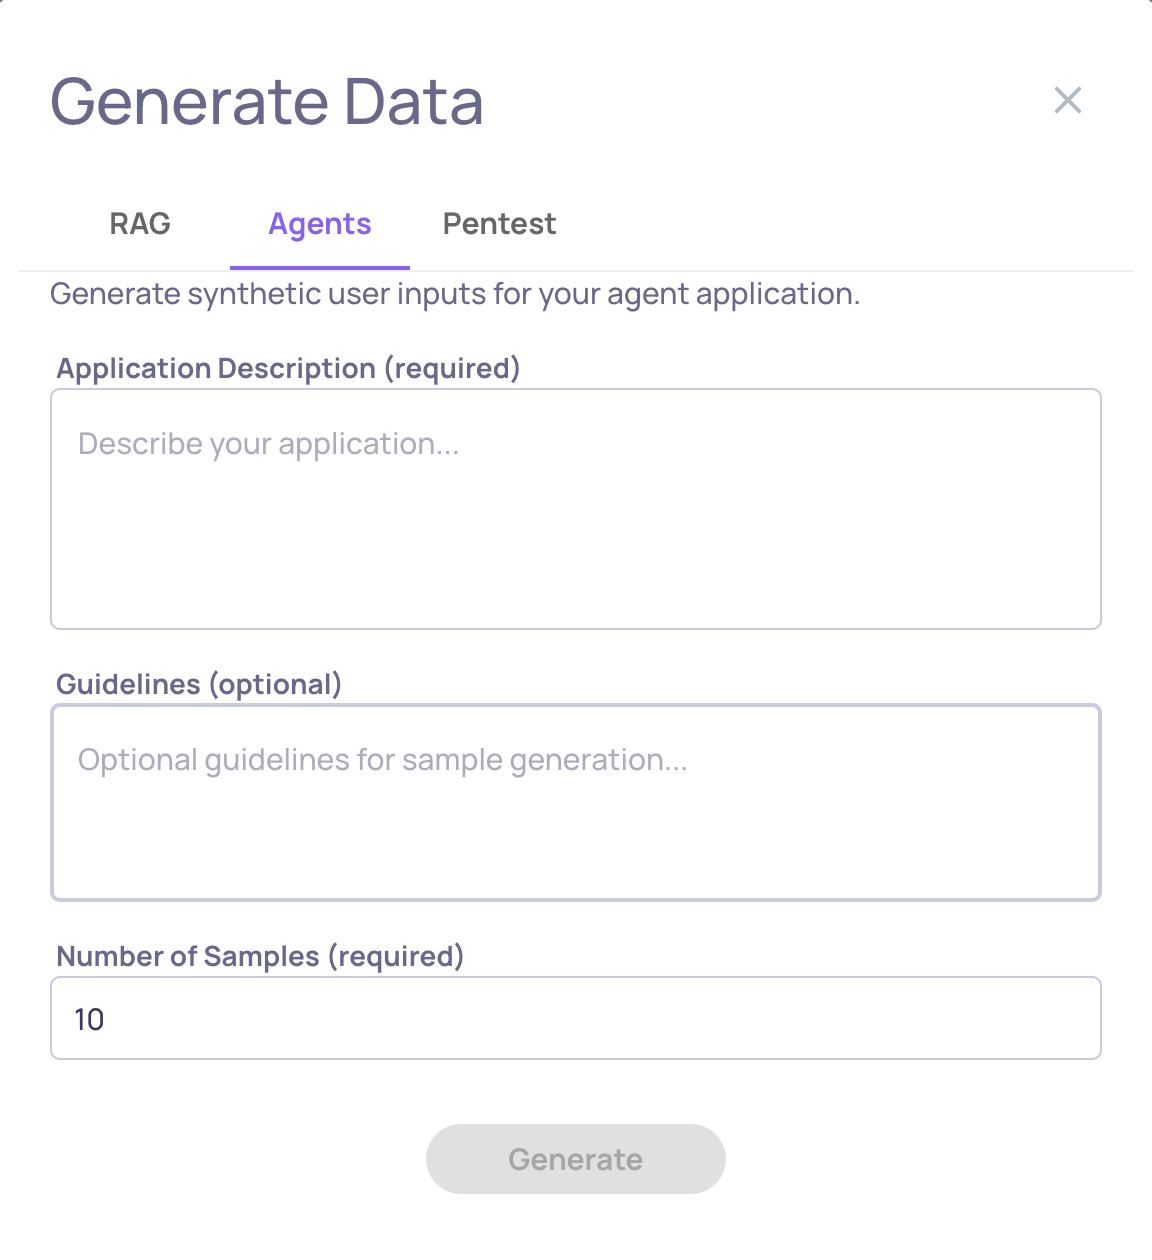
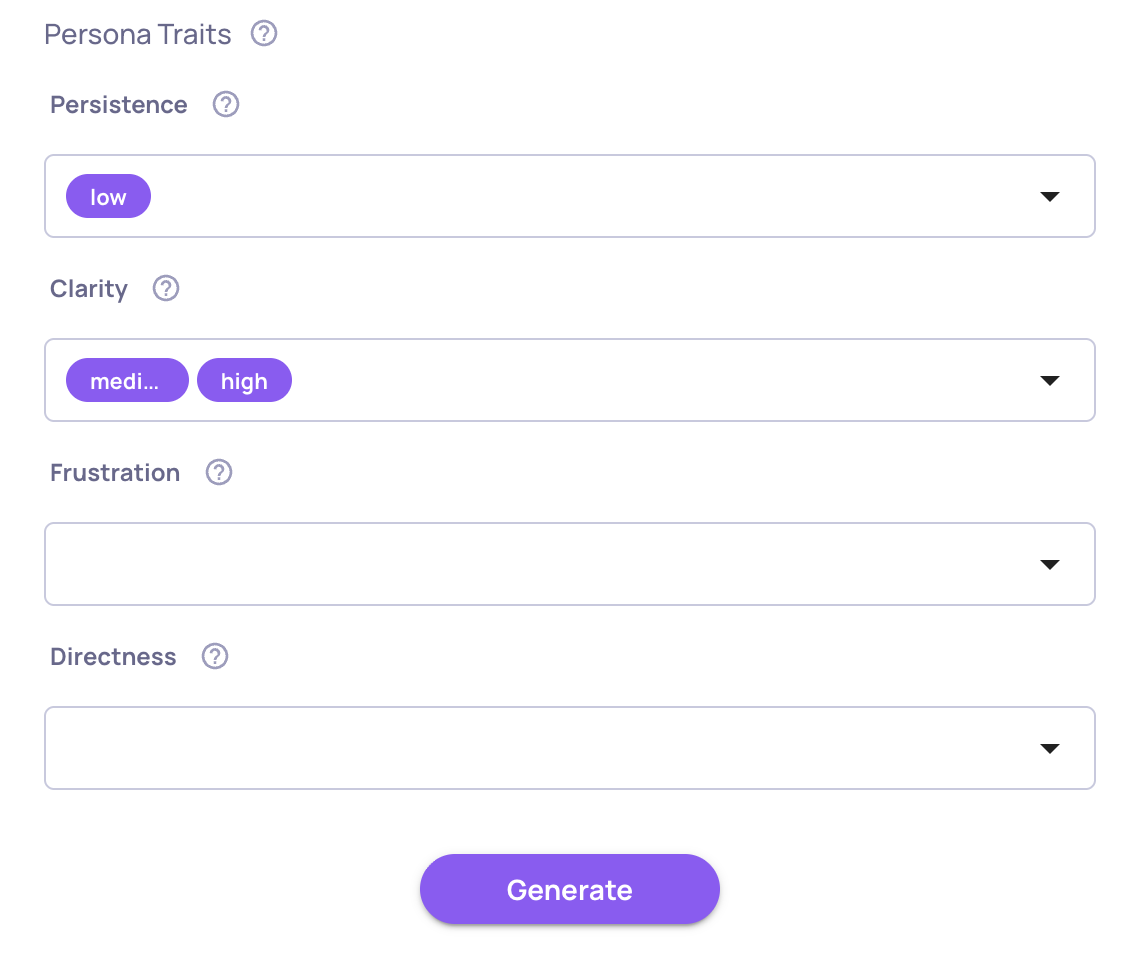
🤖 Multi-Turn Data Generation with Personas
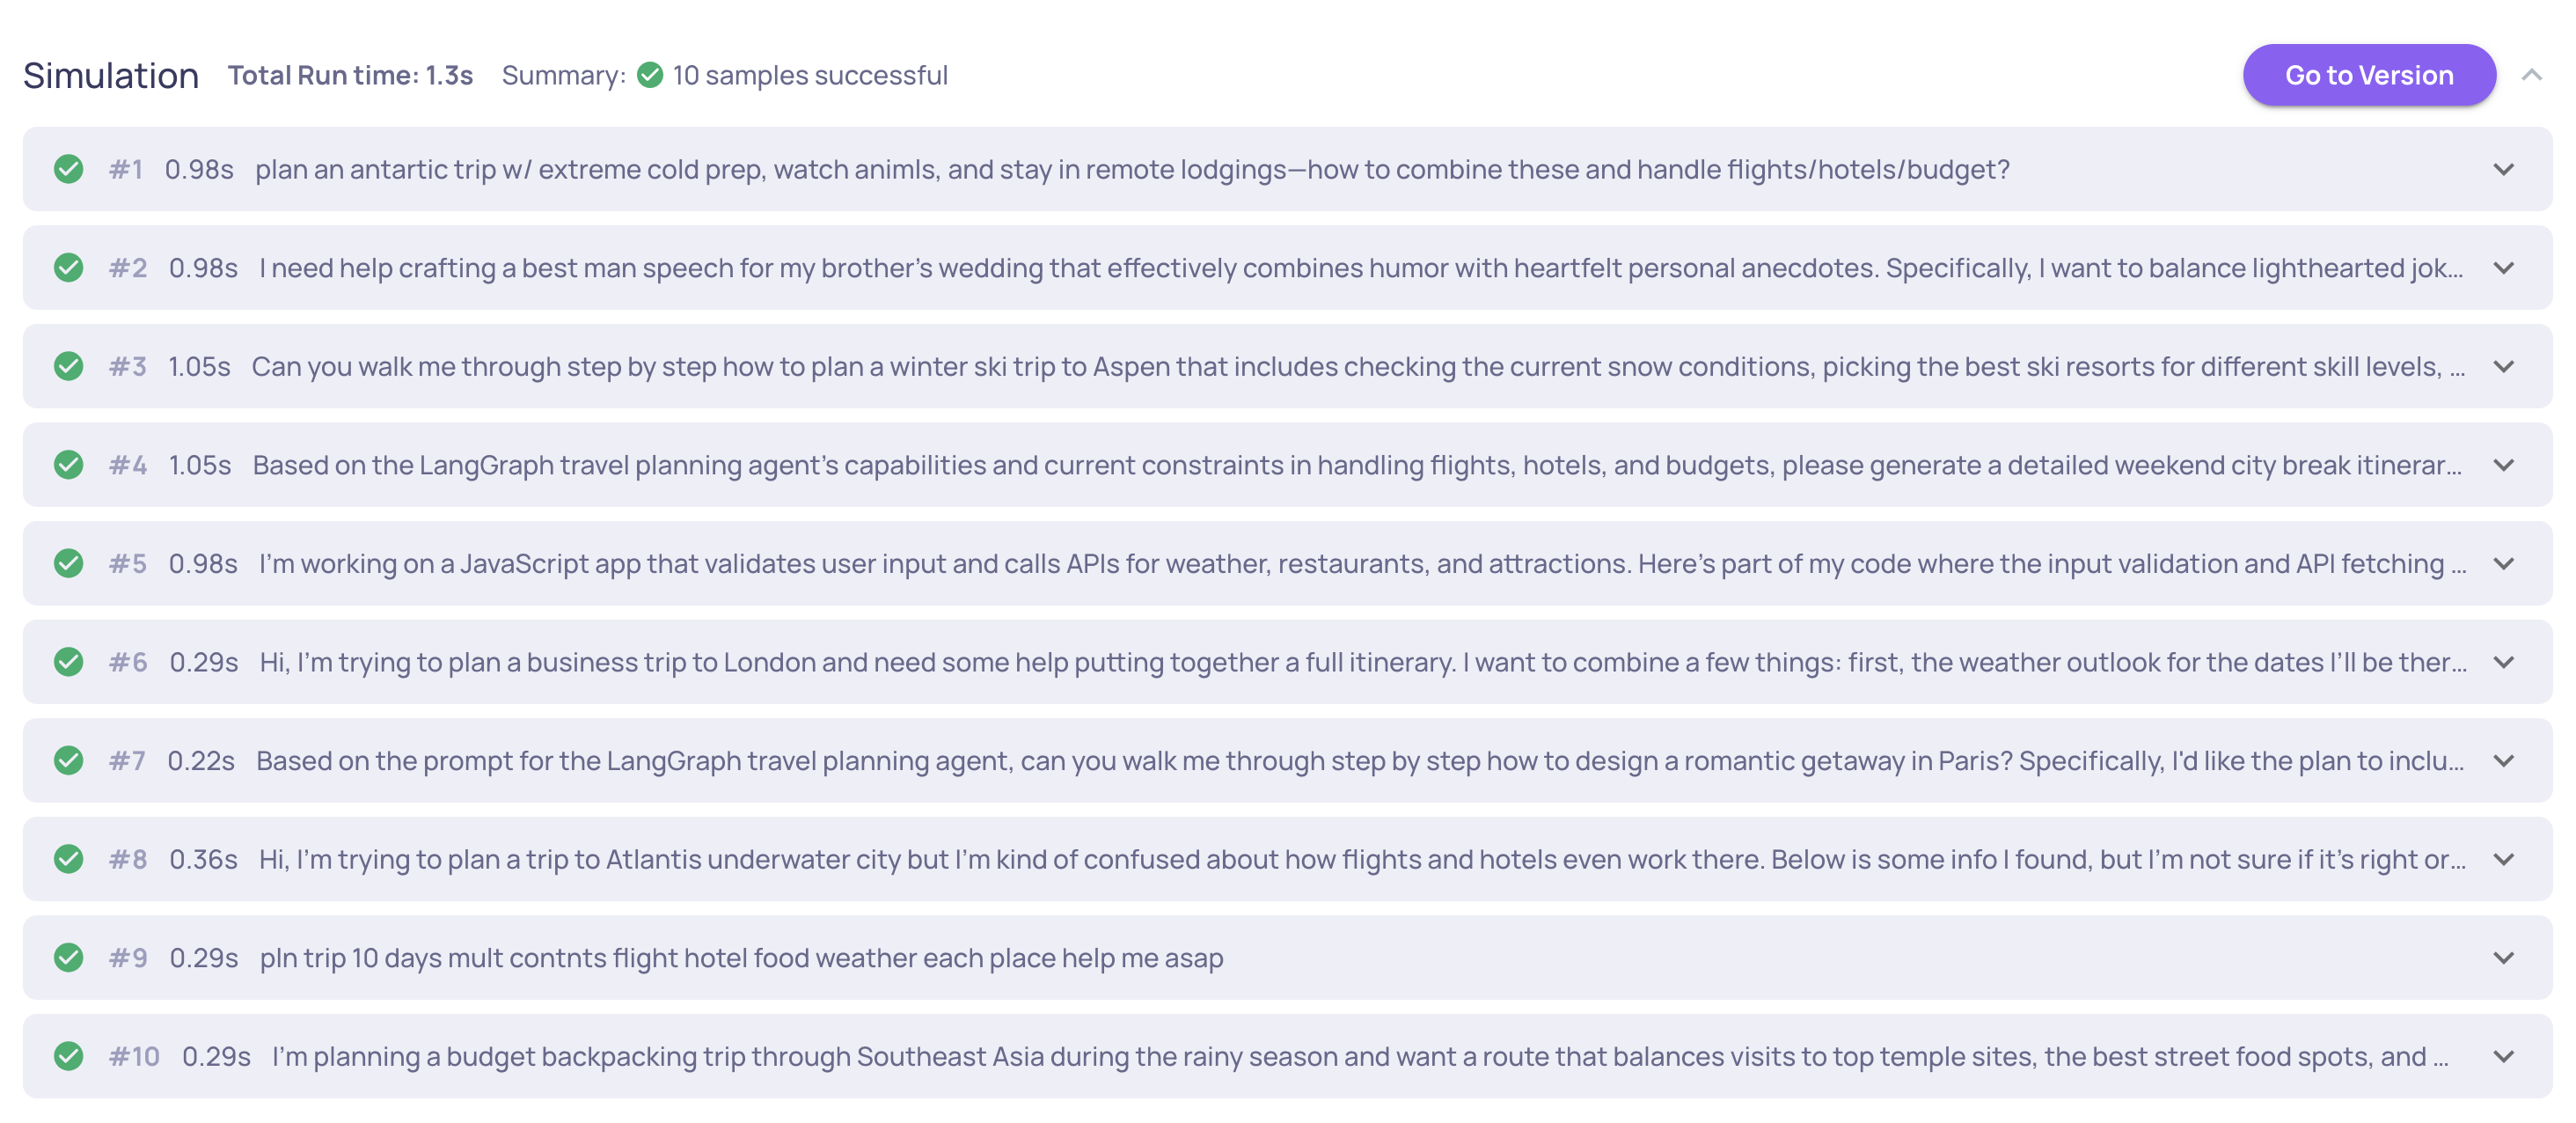
Synthetic data generation has been extended to multi-turn conversations. You can now configure user personas with multi-select trait dimensions that drive how synthetic users behave across turns, with refined guidelines for richer, more realistic conversations. Use it to stress-test agents and chatbots against varied user profiles before they hit production.
🎯 GIC New Scoring System
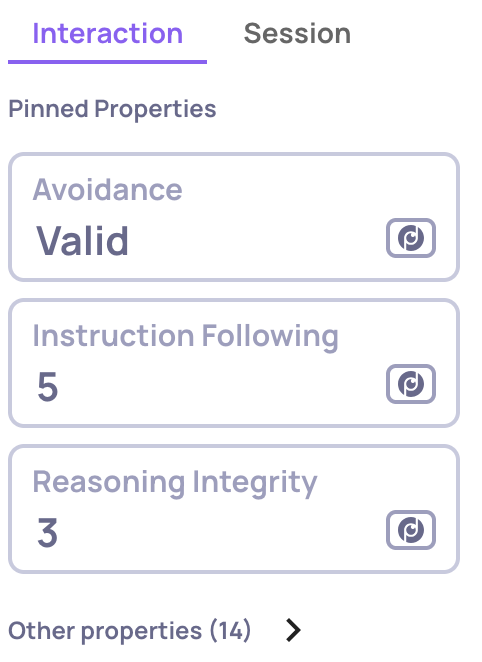
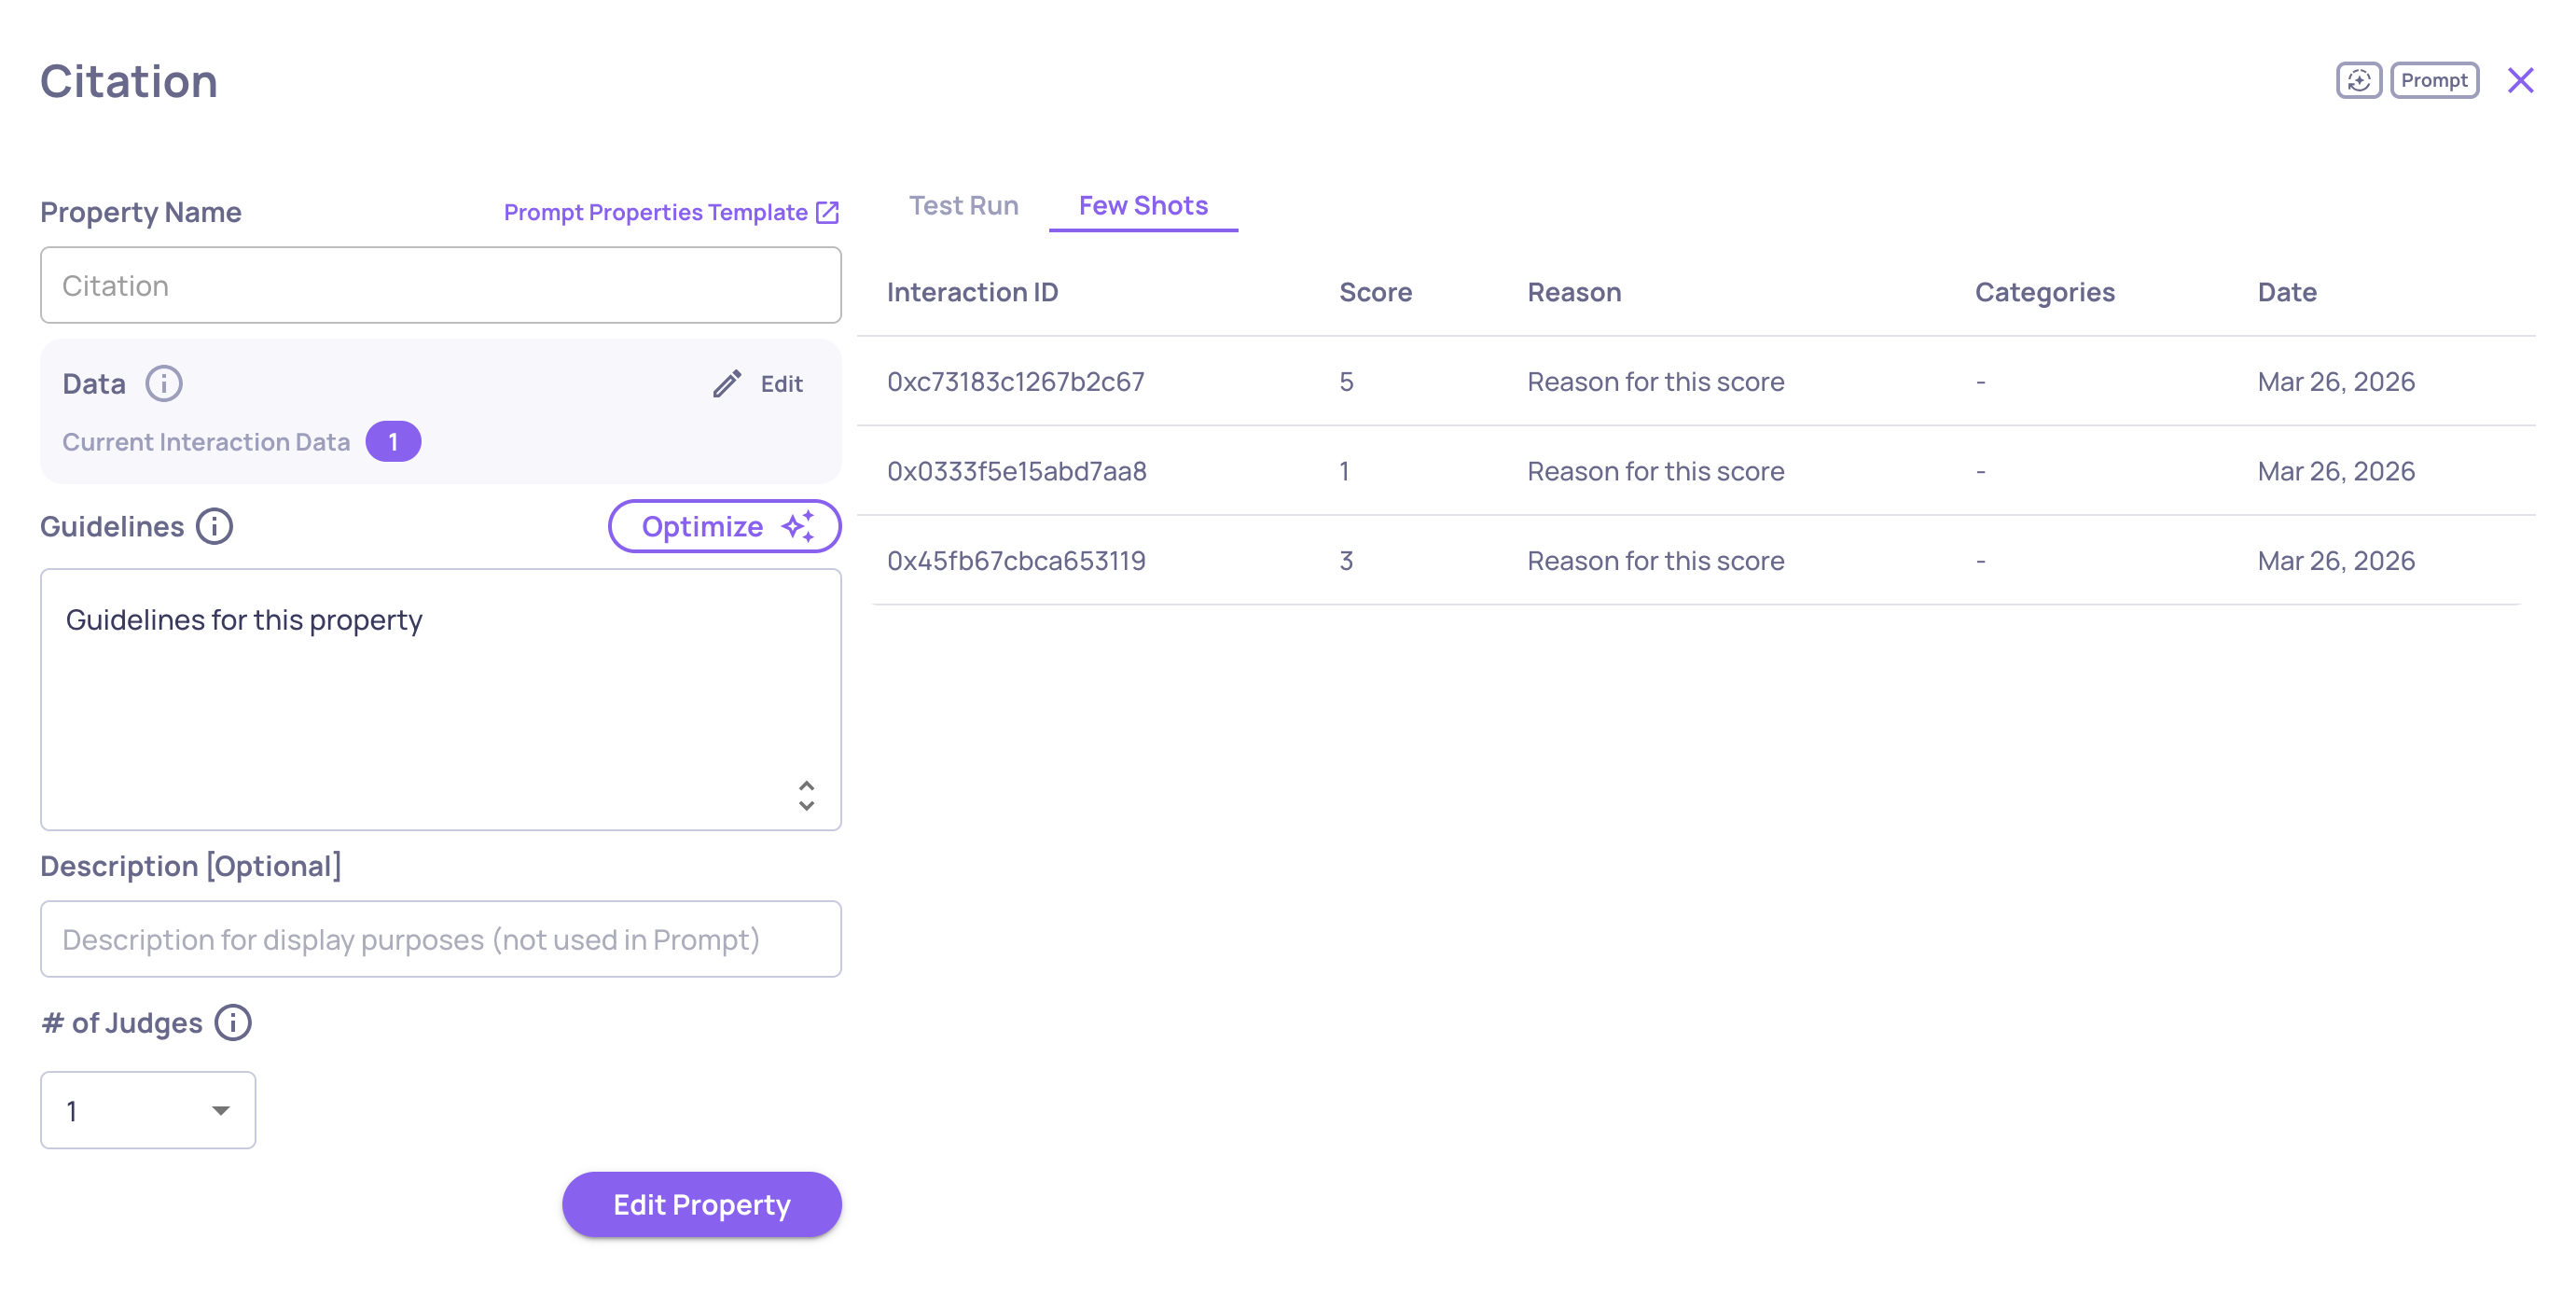
The Grounded-in-Context (GIC) property uses a new scoring system that better reflects how much of the response is actually grounded in the provided context.
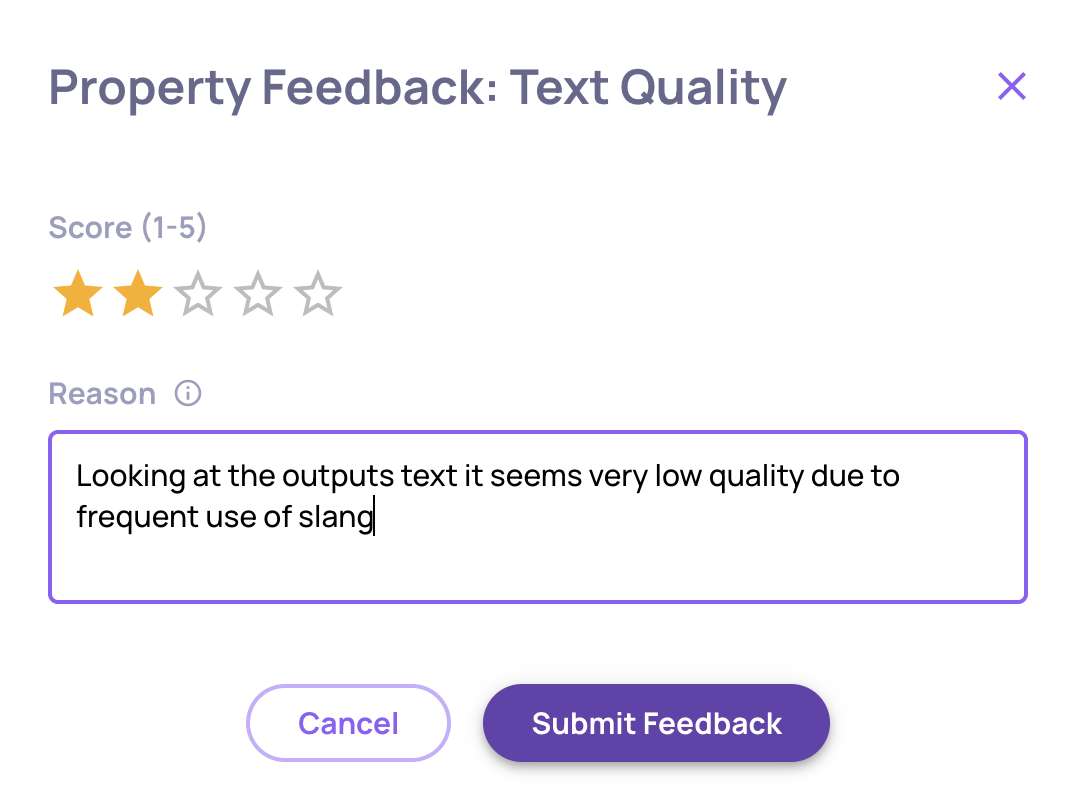
🕓 Manual Annotation History
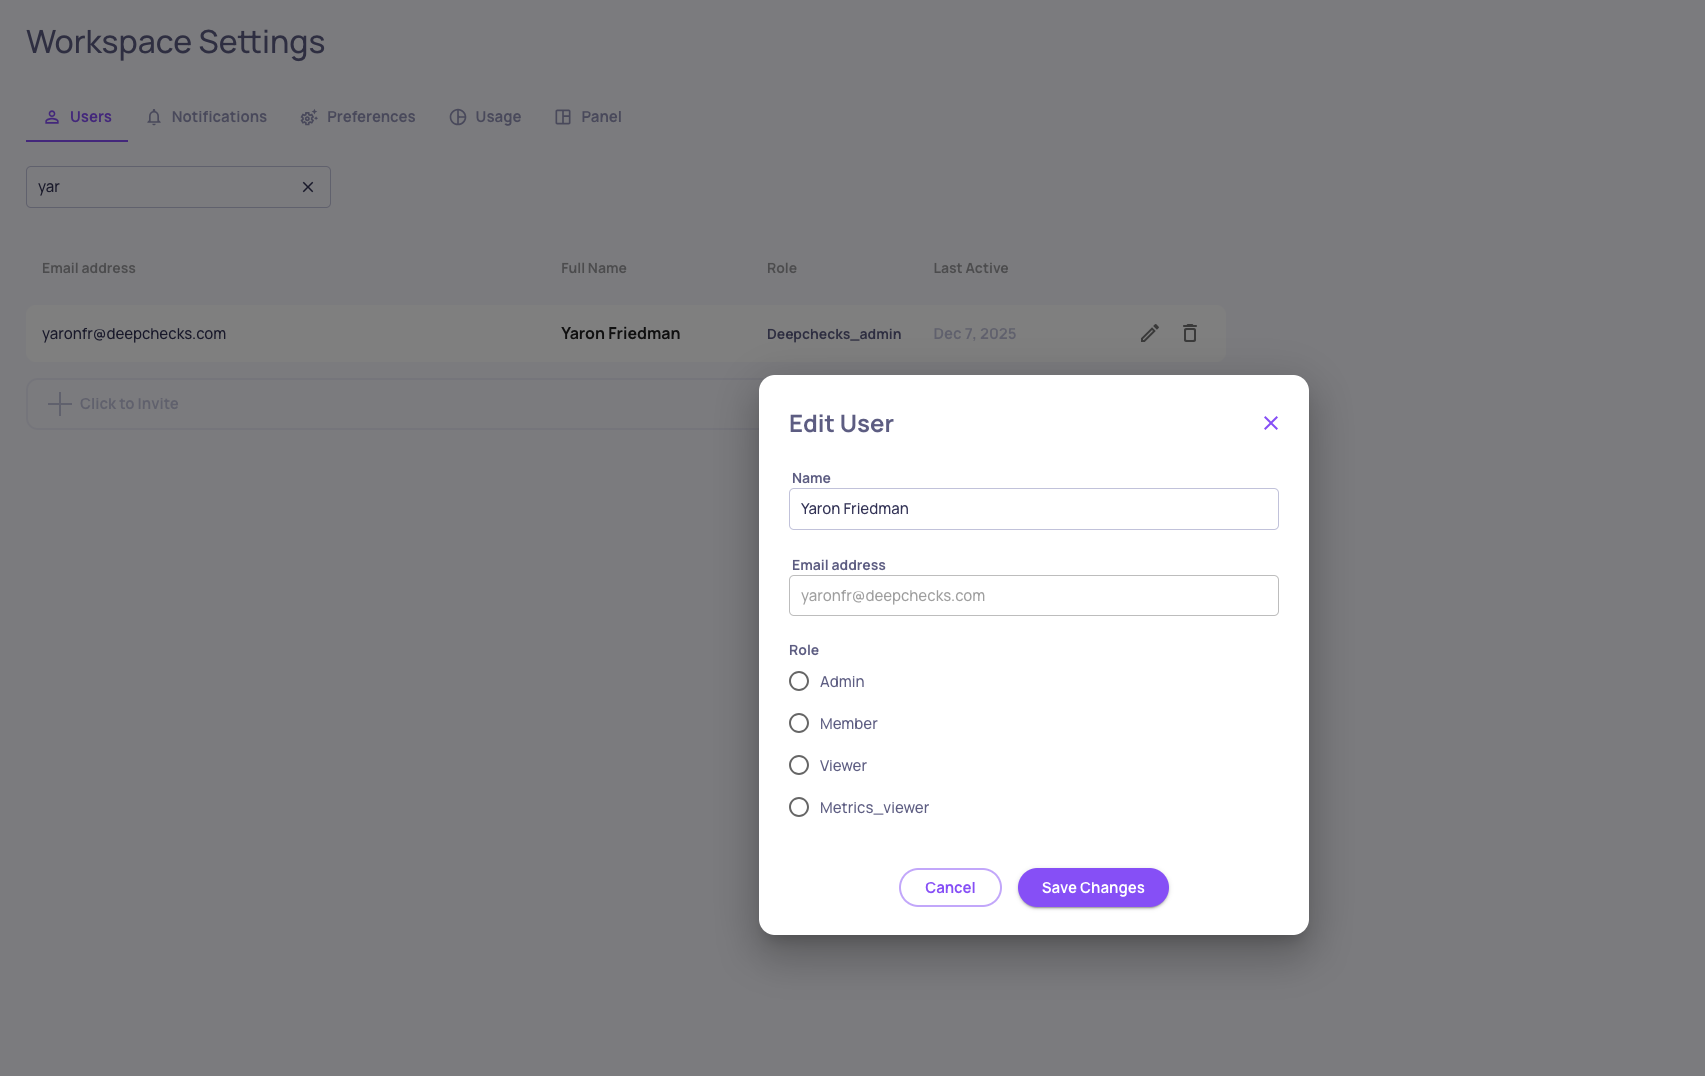
Manual annotations now keep a full history of past values. Whenever a reviewer overwrites a manual annotation, the previous value, reason, annotator, and timestamp are saved and shown in the annotation editor - so you can see how a label evolved, who changed it, and why. Old entries can be deleted individually, and the history is also returned by the interaction endpoints for programmatic access.
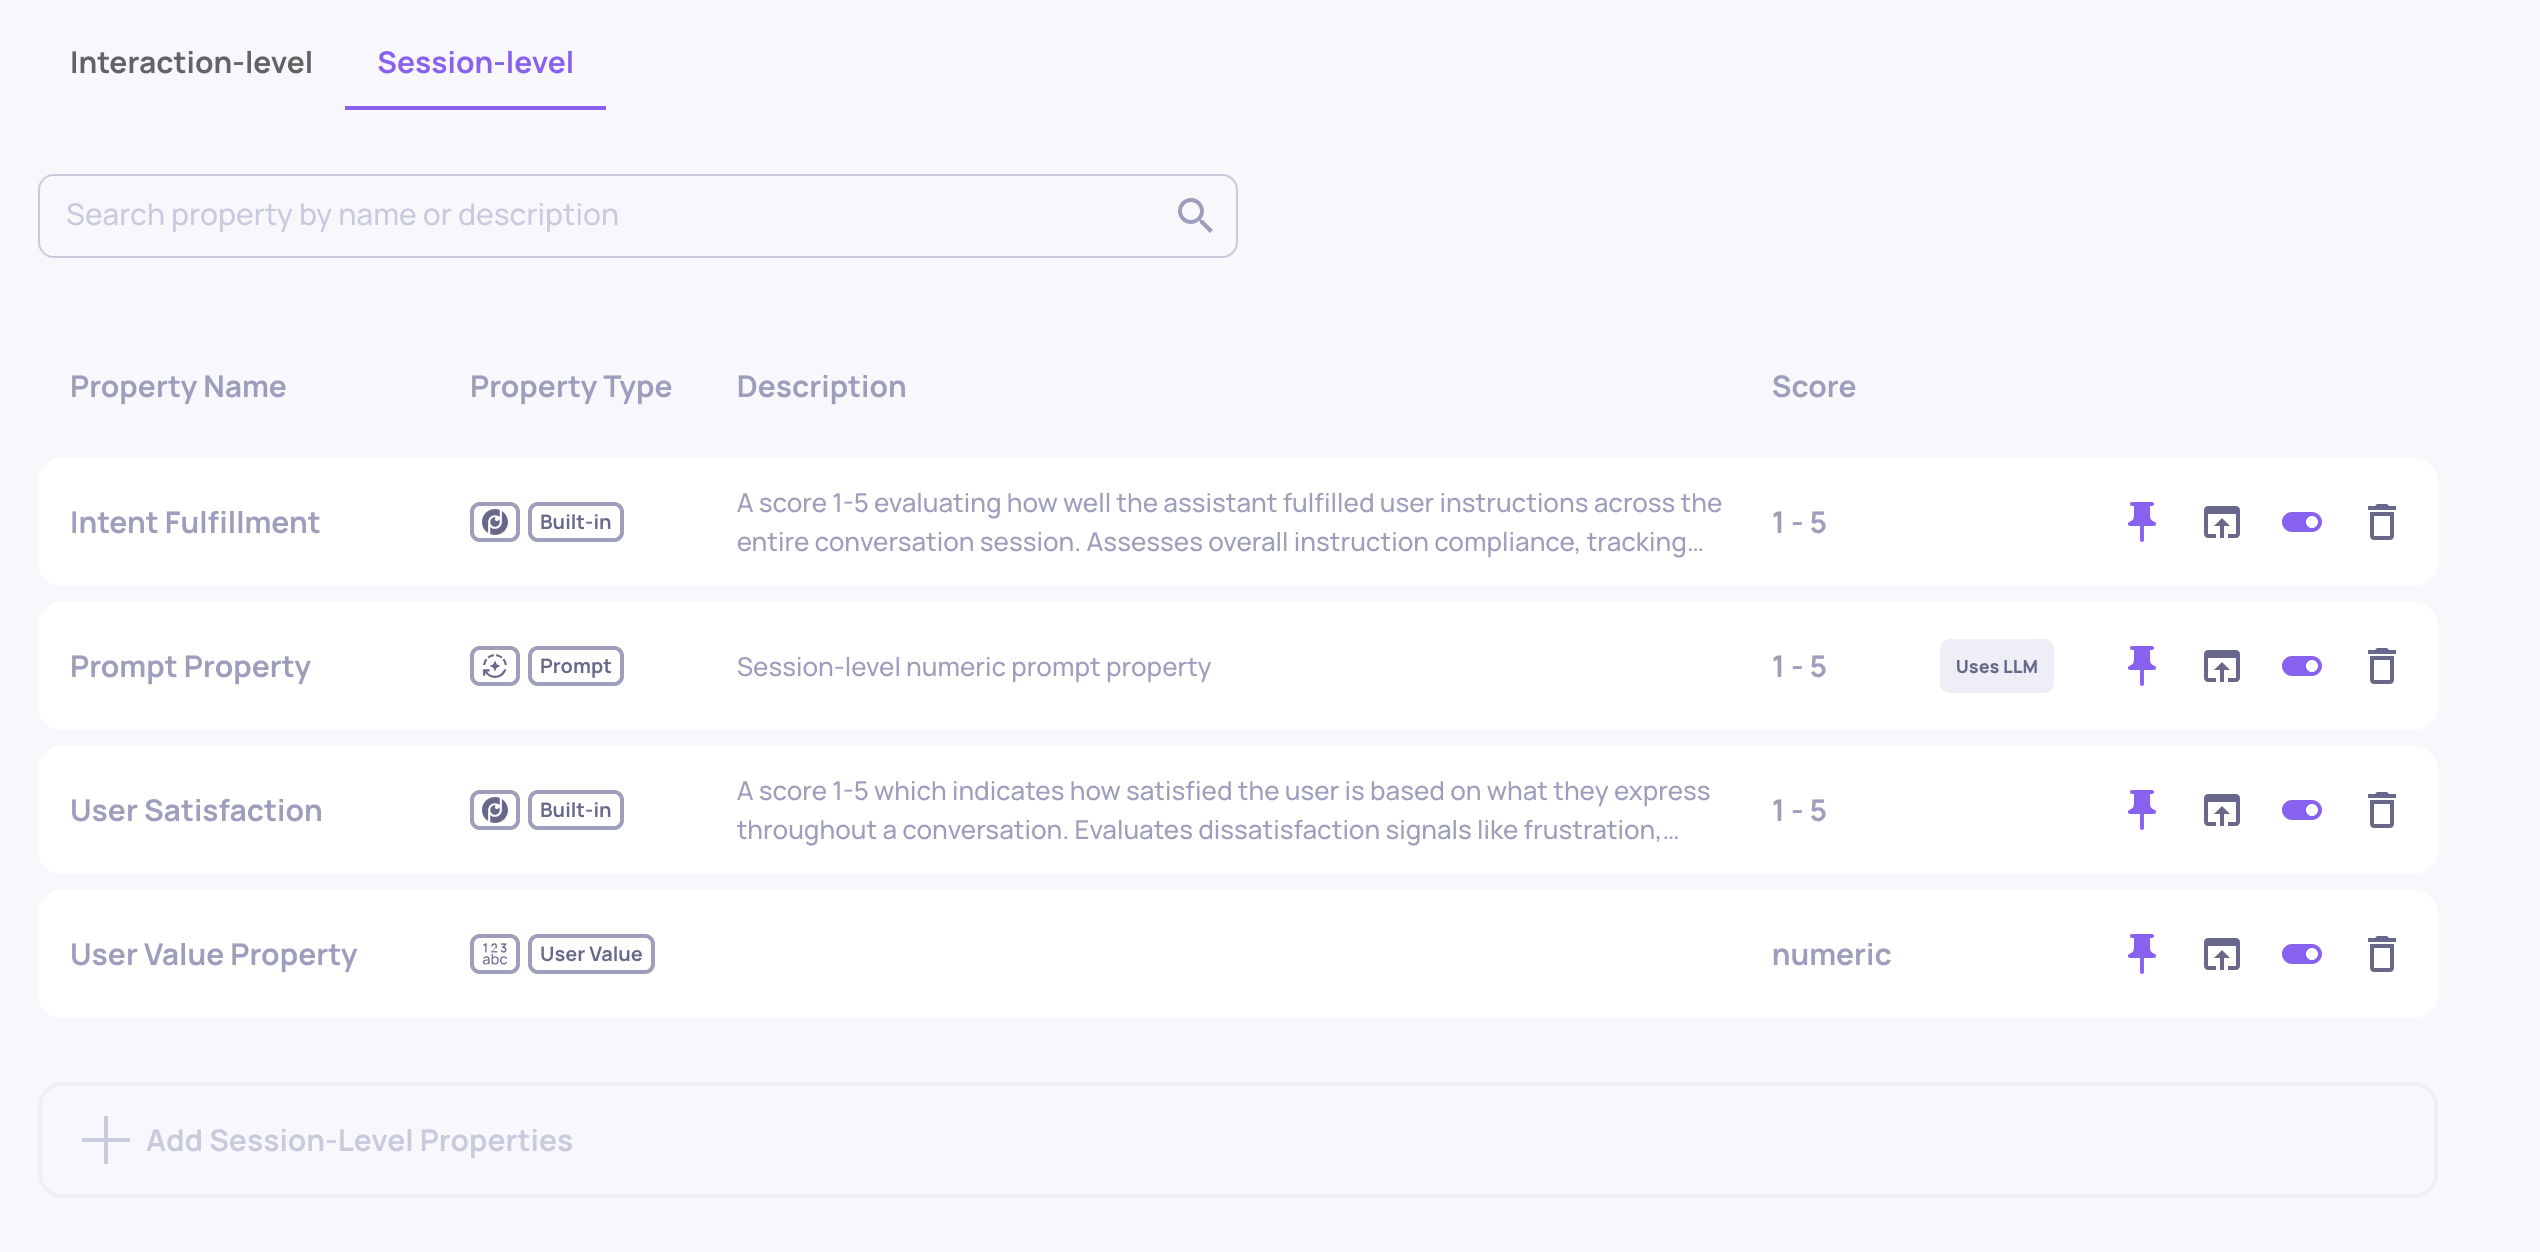
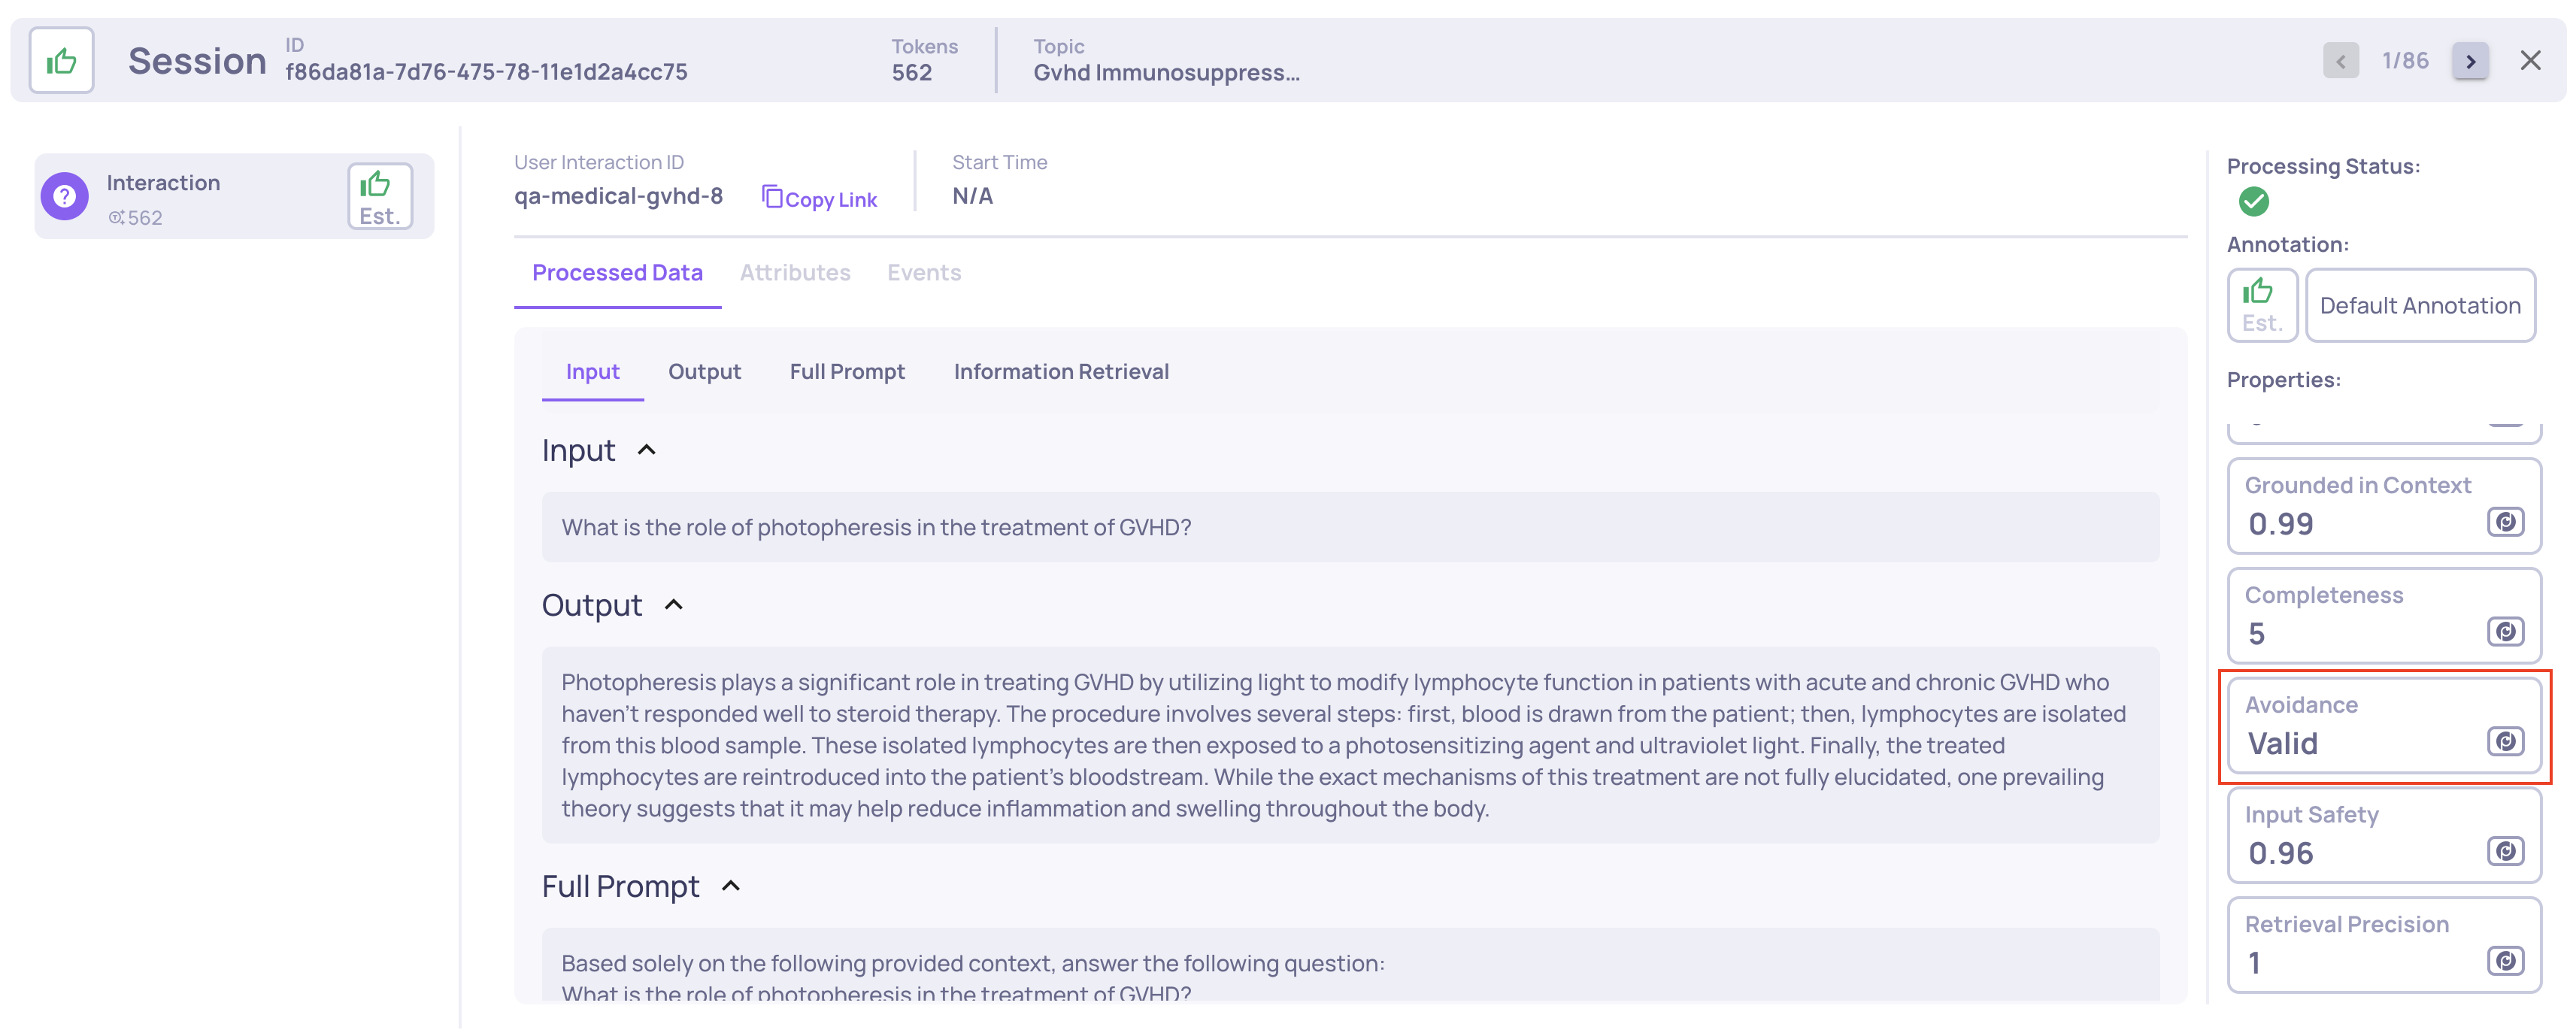
🆕 Response Type Built-In Property
A new built-in property, Response Type, classifies what kind of response your model produced (e.g. answer, refusal, clarification, etc.). It's available out of the box for any application, no setup required.
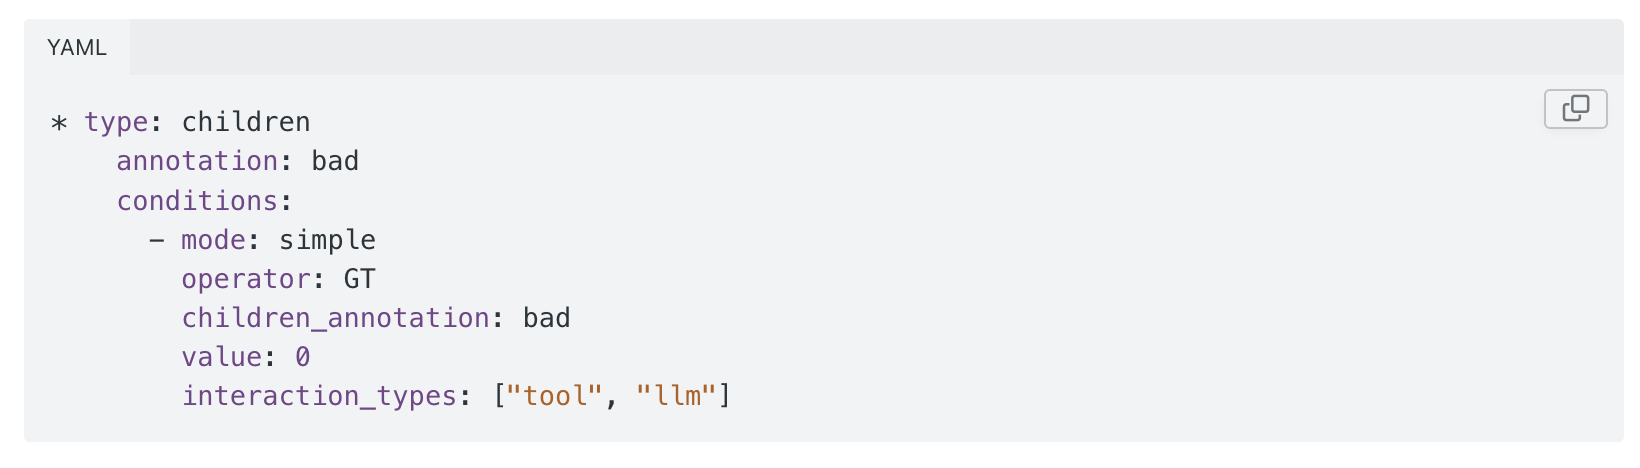
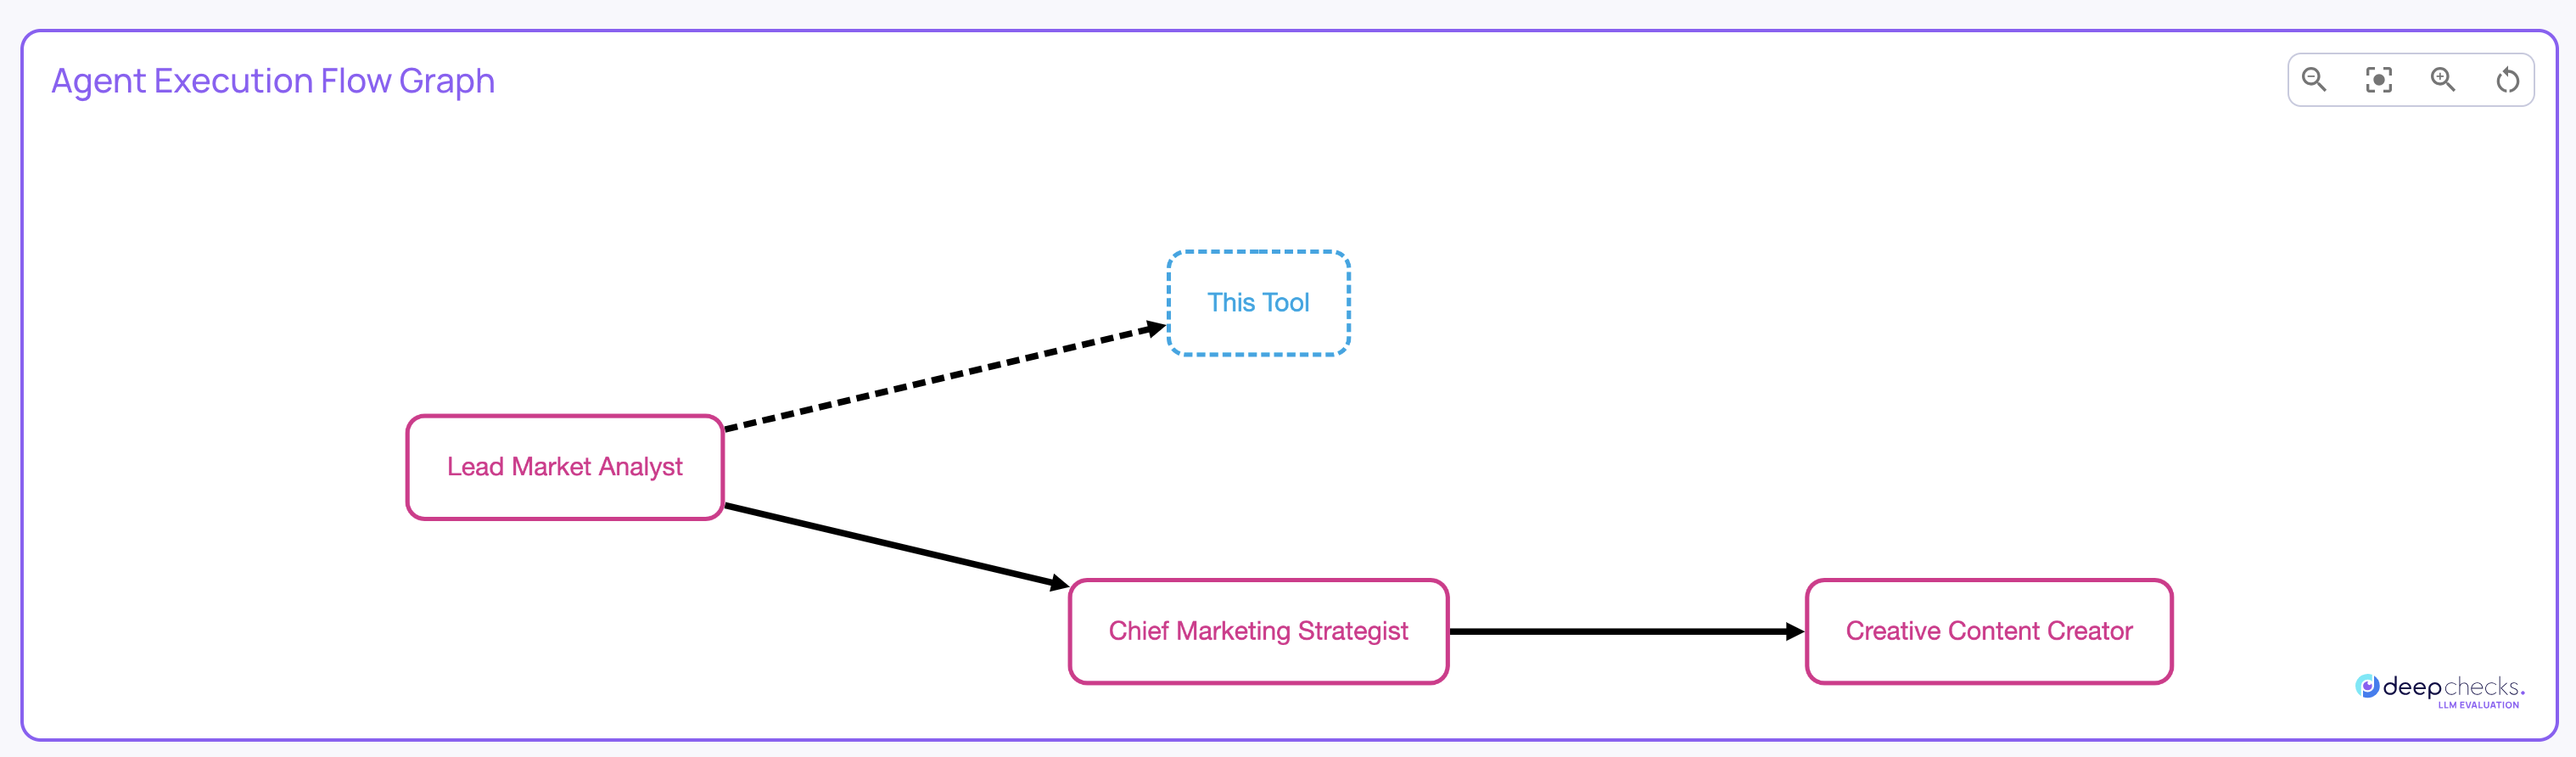
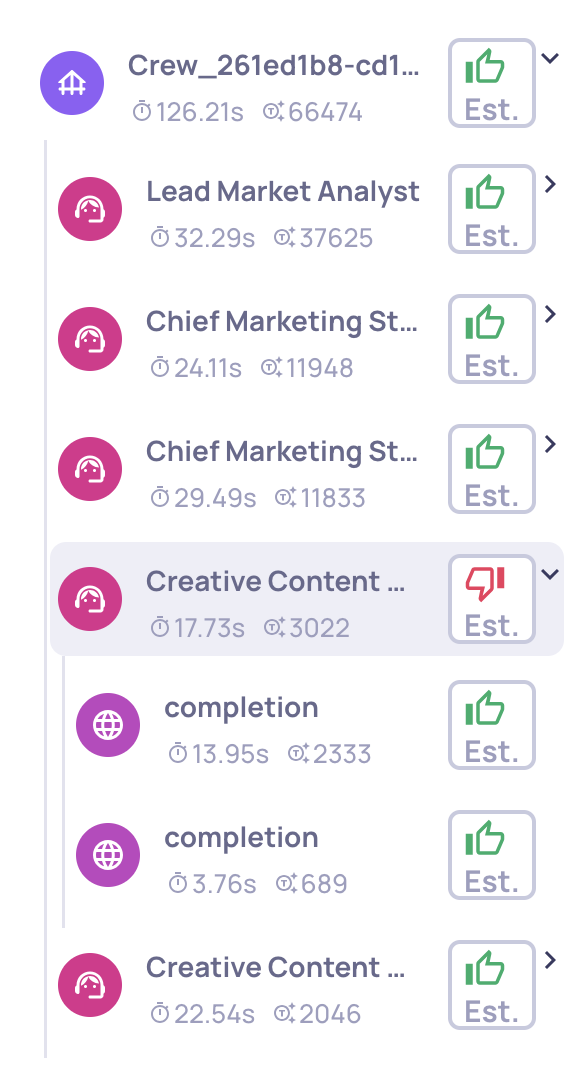
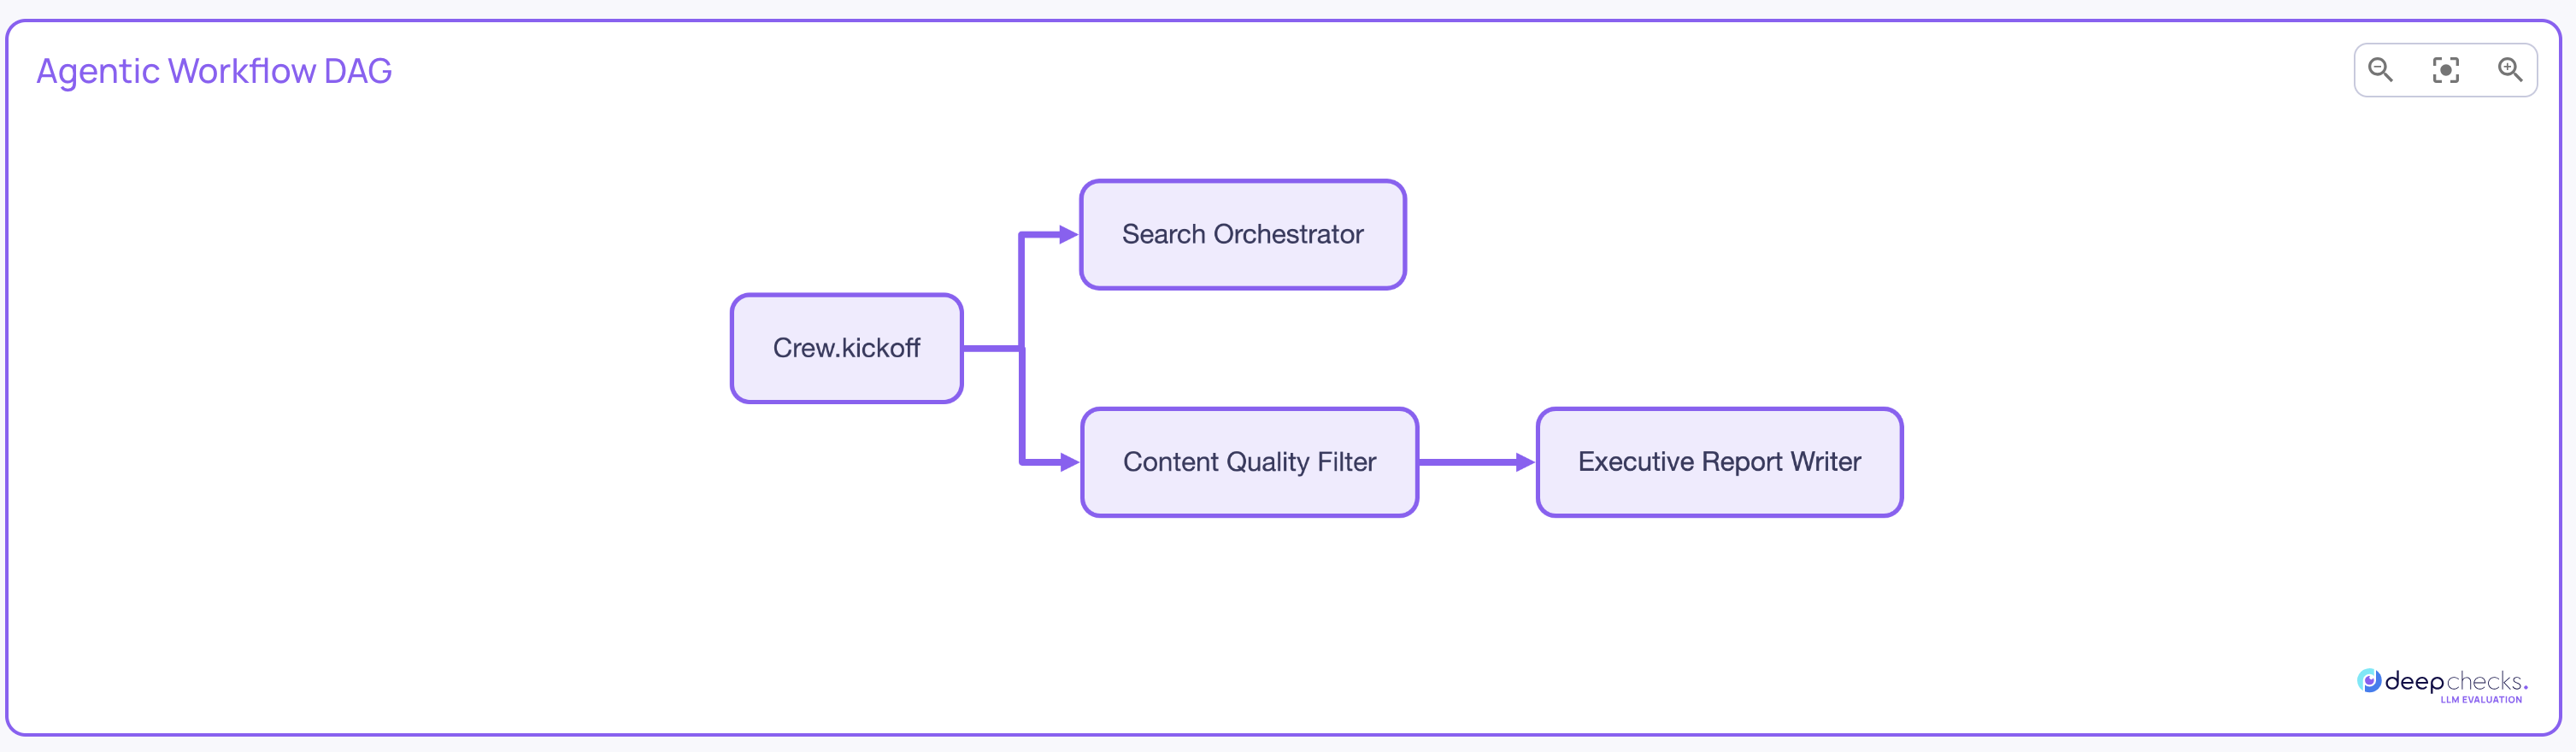
🧰 Tool Abuse & Error Detection in HPI
Tool Abuse and Error Detection are now part of the default High-Level Property Insights list and contribute to insight generation. Both properties were previously available but are now active by default for agentic applications.
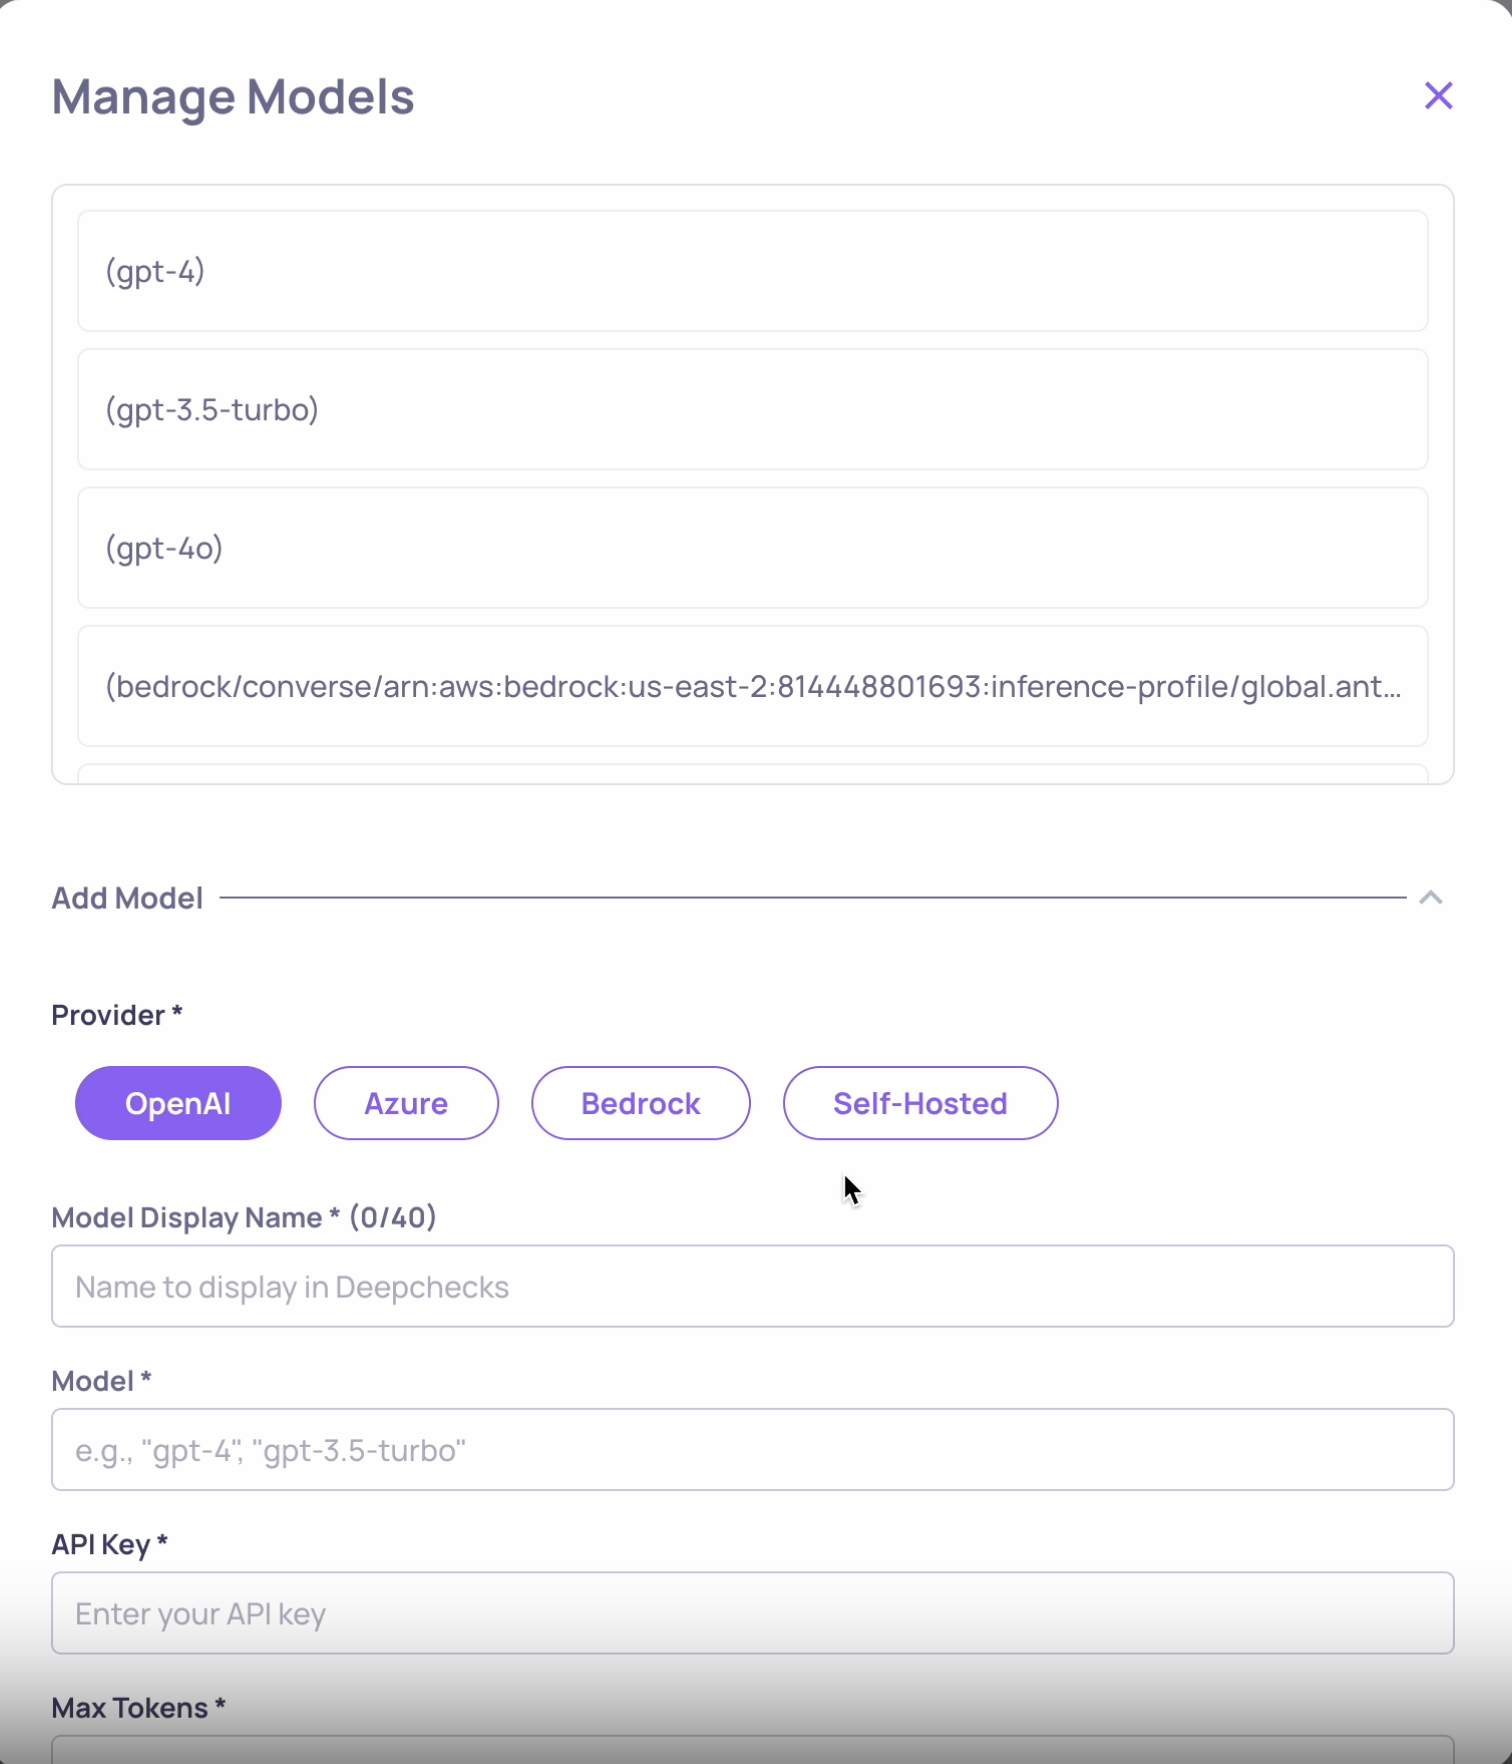
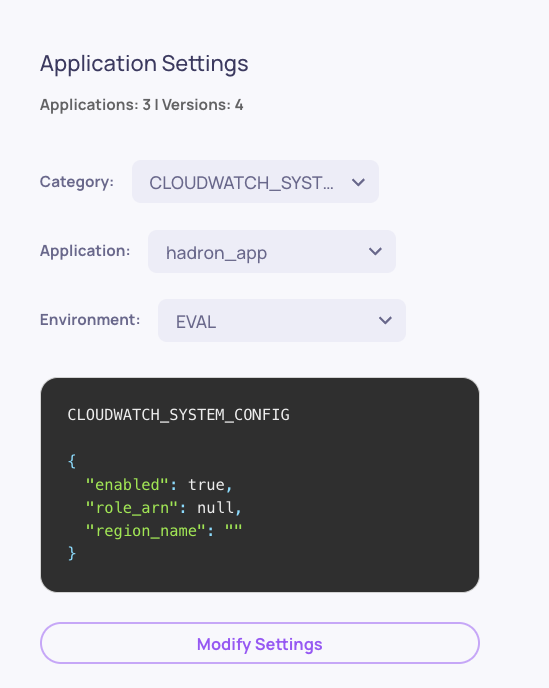
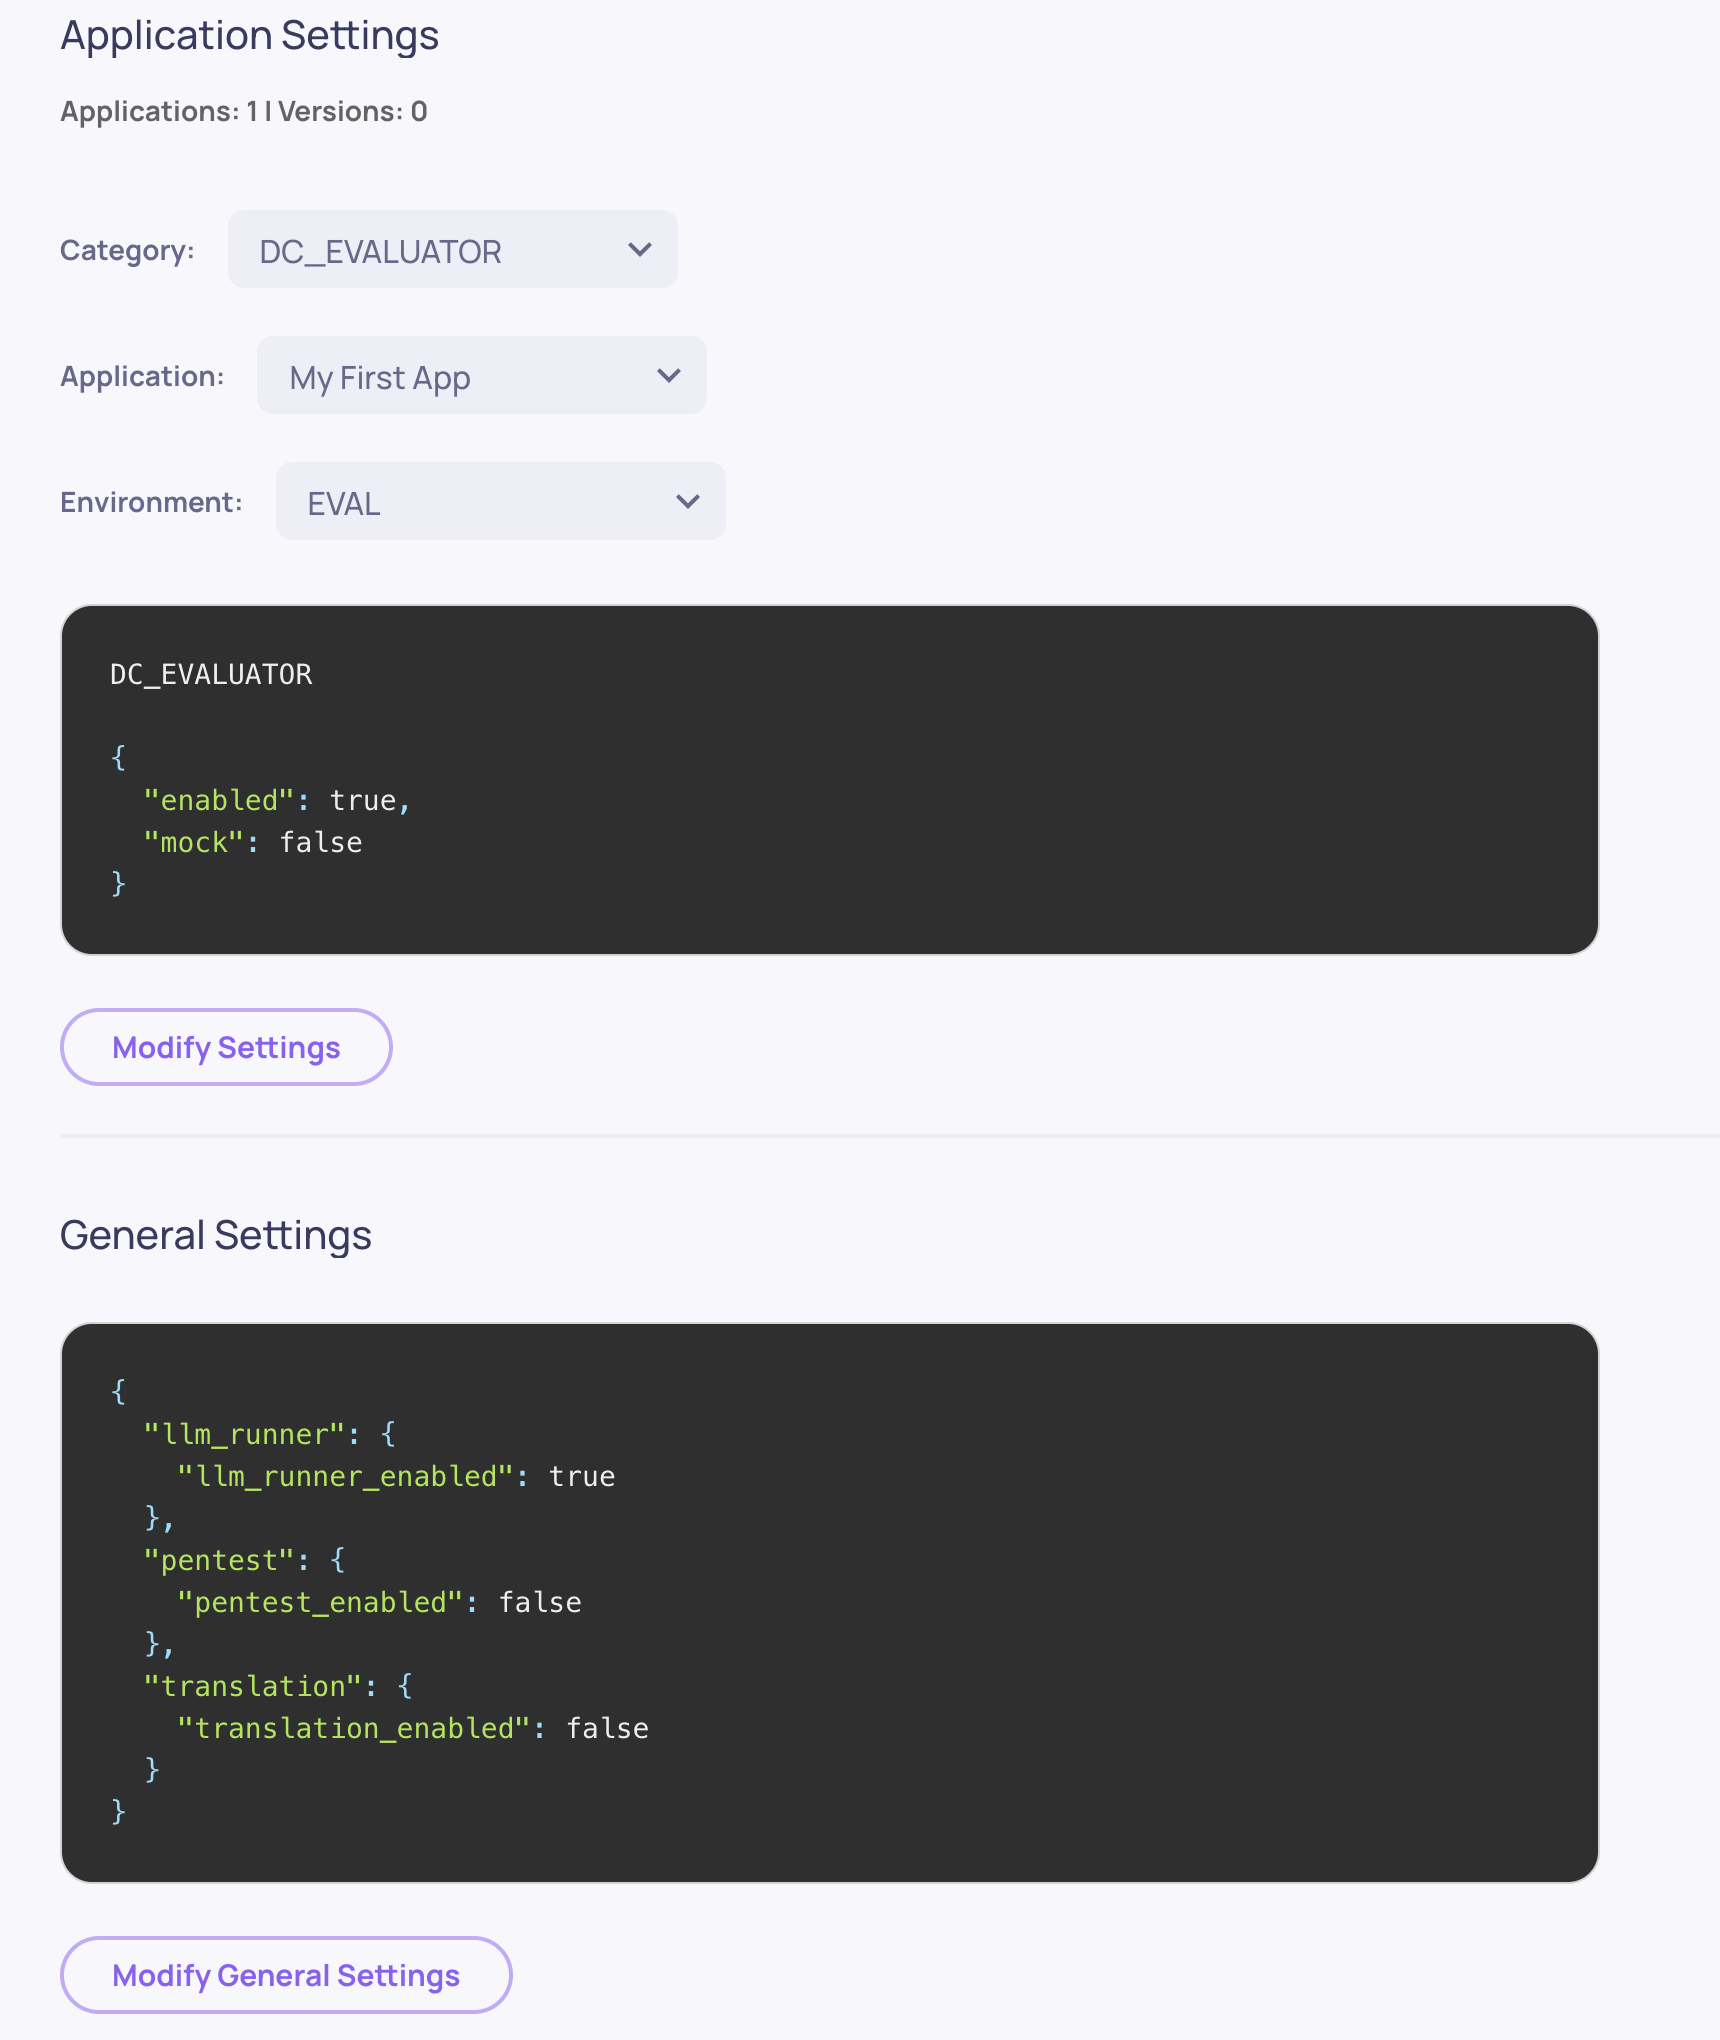
🛠️ SDK: App & Workspace Configuration
The SDK now exposes first-class methods for reading and updating application and workspace configurations programmatically. Use it to script environment setup, sync configurations across deployments, and version-control your app behavior.
# read & update app config
config = client.get_application_config(application_id)
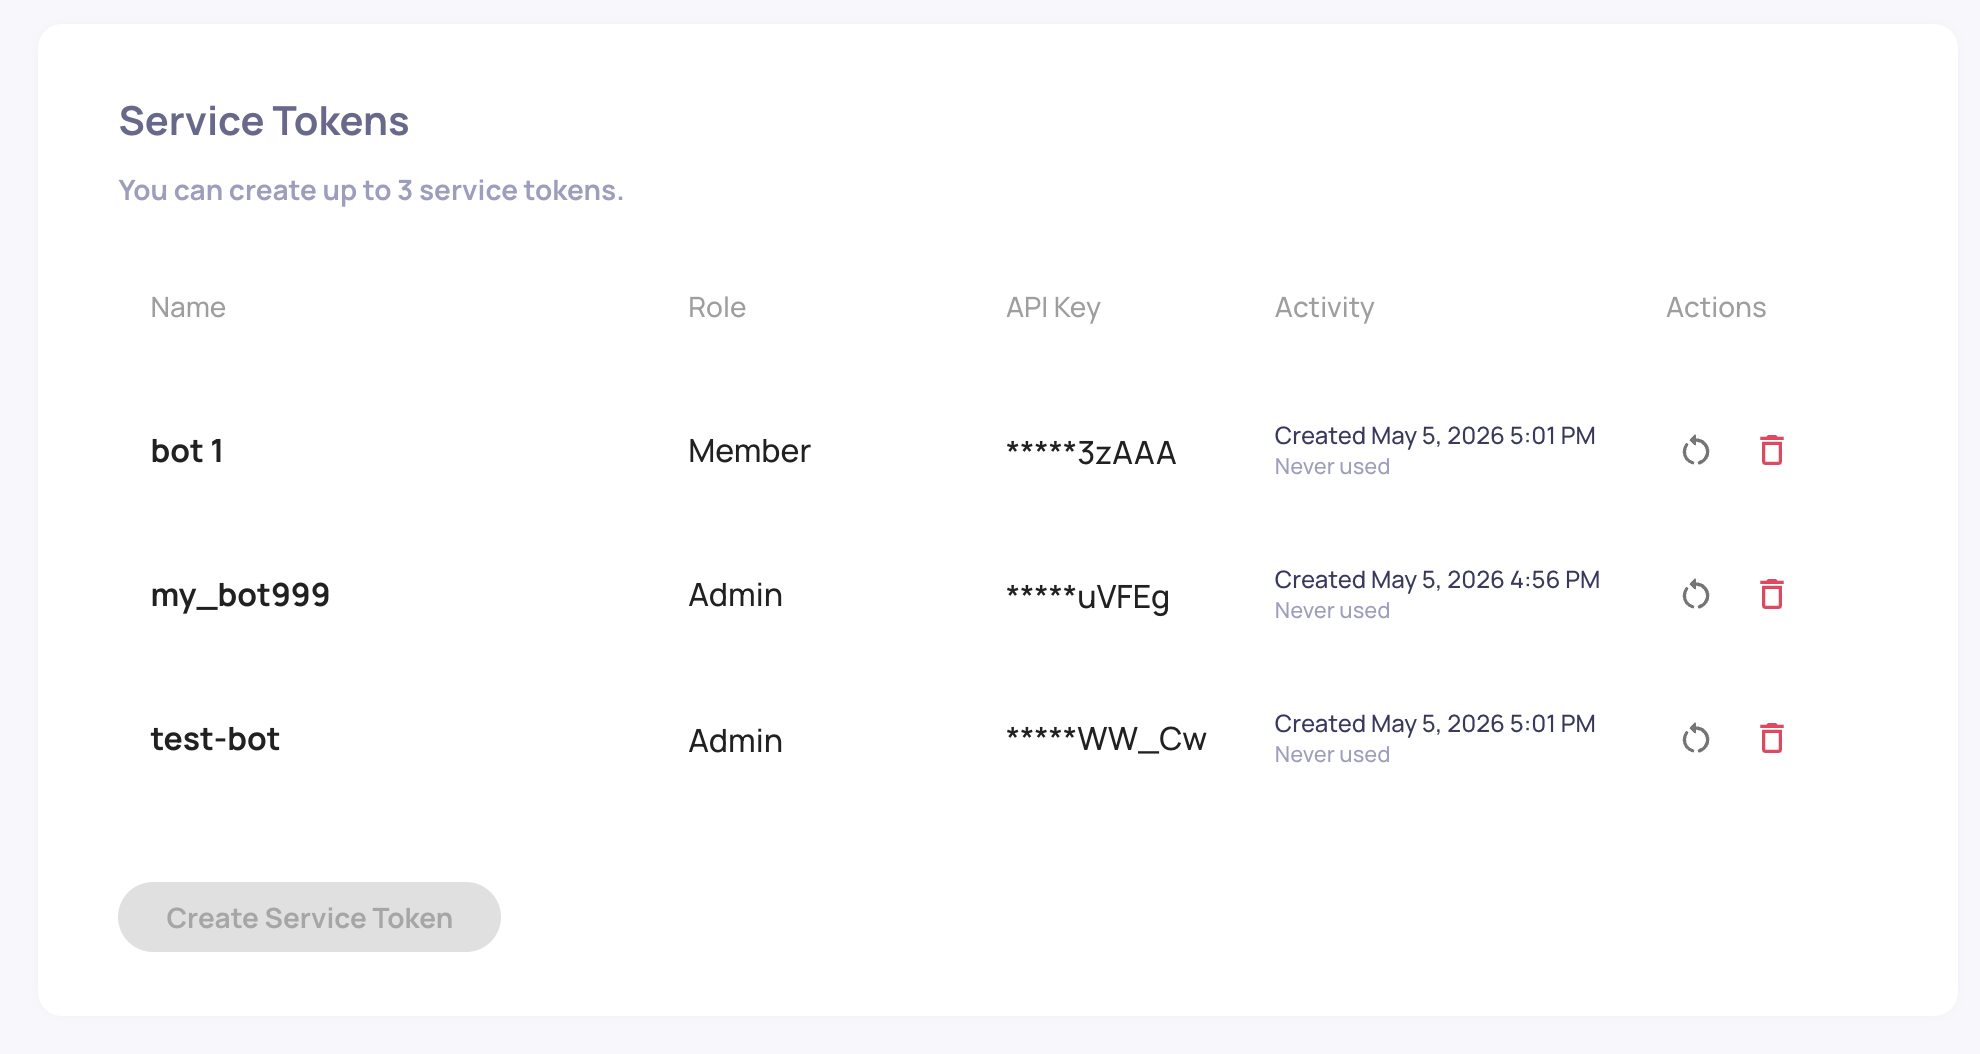
client.update_application_config(application_id, config)🔑 API Keys & Service Tokens Overhaul
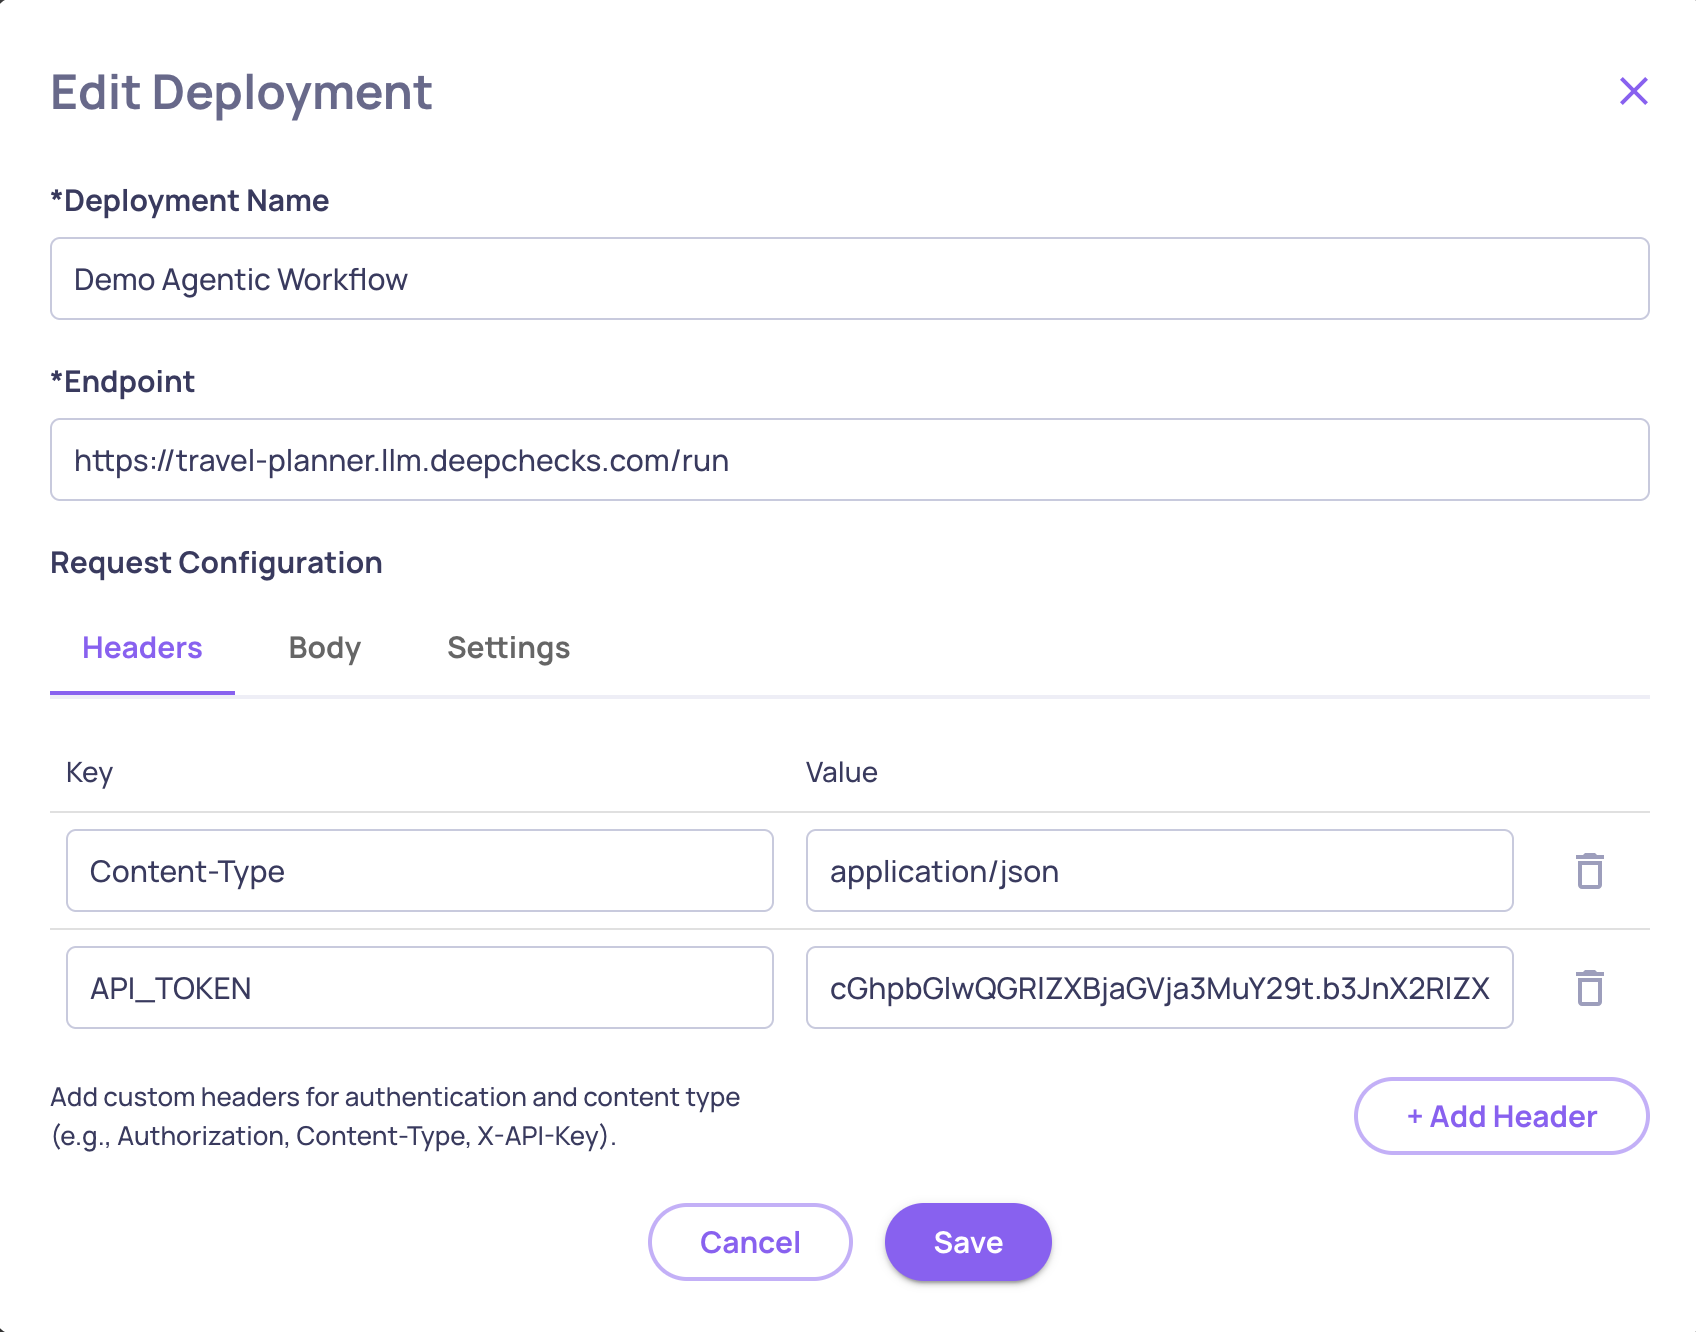
Service Tokens are a brand-new way to authenticate programmatic access to Deepchecks LLM. Instead of relying on personal user API keys for automation, you can now create dedicated service-token identities scoped to specific applications - ideal for CI pipelines, ingestion jobs, and backend services. Tokens are managed from a dedicated Service Tokens tab alongside the redesigned API Keys table, with admin controls for creation, editing, and revocation.
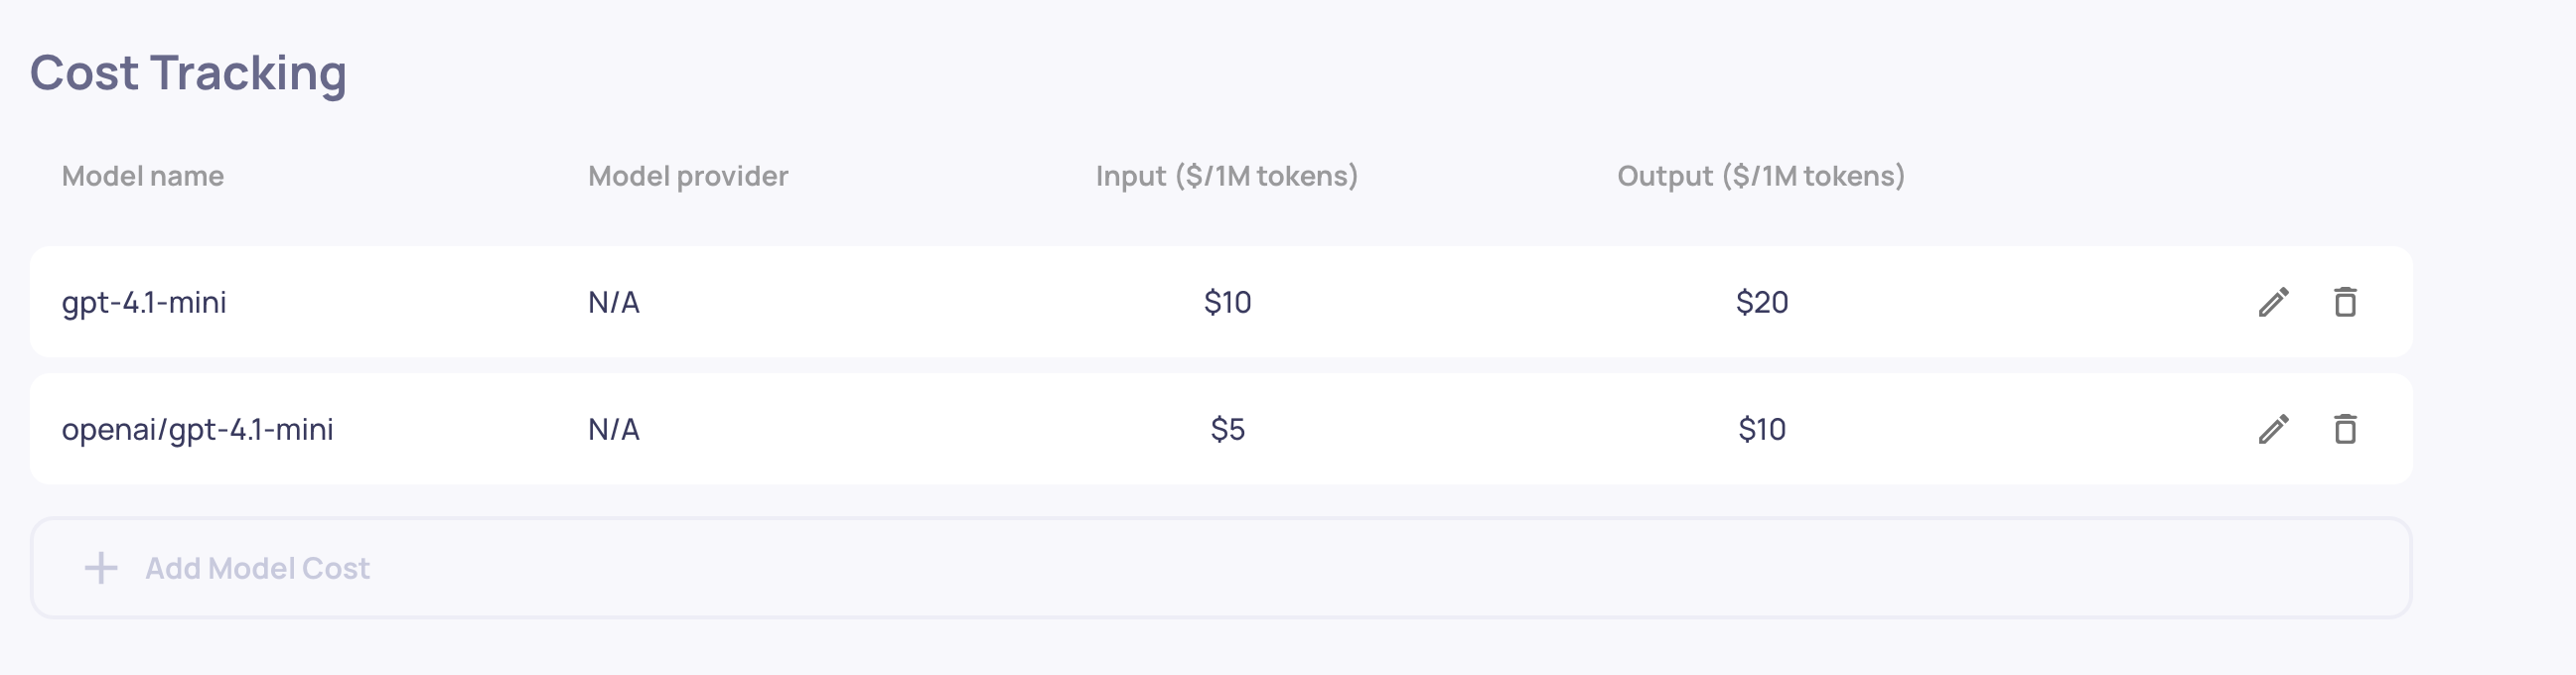
📥 Granular Per-Call Usage CSV
For customers who need detailed usage tracking, Deepchecks can now export granular per-call LLM usage as a CSV. Use it for internal billing, audit, or cost analysis across applications and properties.
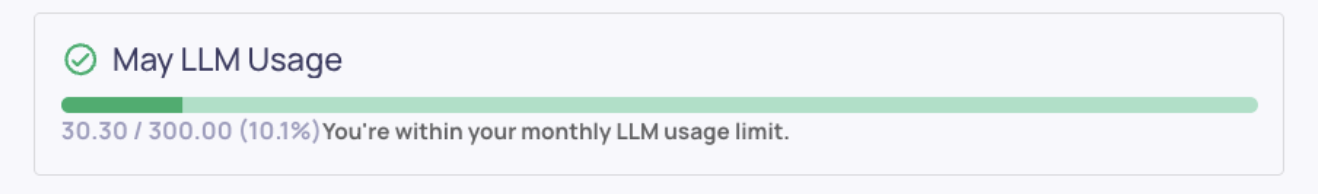
🚦 Owner-Configurable LLM Usage Limits
In AWS SageMaker / self-hosted deployments, deployment owners can now configure monthly LLM usage limits per organization, with proactive notifications at 50%, 75%, 90%, and a hard stop at 100%. Use it to control costs and prevent runaway consumption across multi-tenant self-hosted setups.
📖 New SDK Reference Docs
The SDK reference documentation has been migrated from Sphinx to a new ReadMe.com-based pipeline powered by griffe. The result: a faster, cleaner, more navigable SDK reference that lives alongside the rest of the product documentation at docs.deepchecks.com.
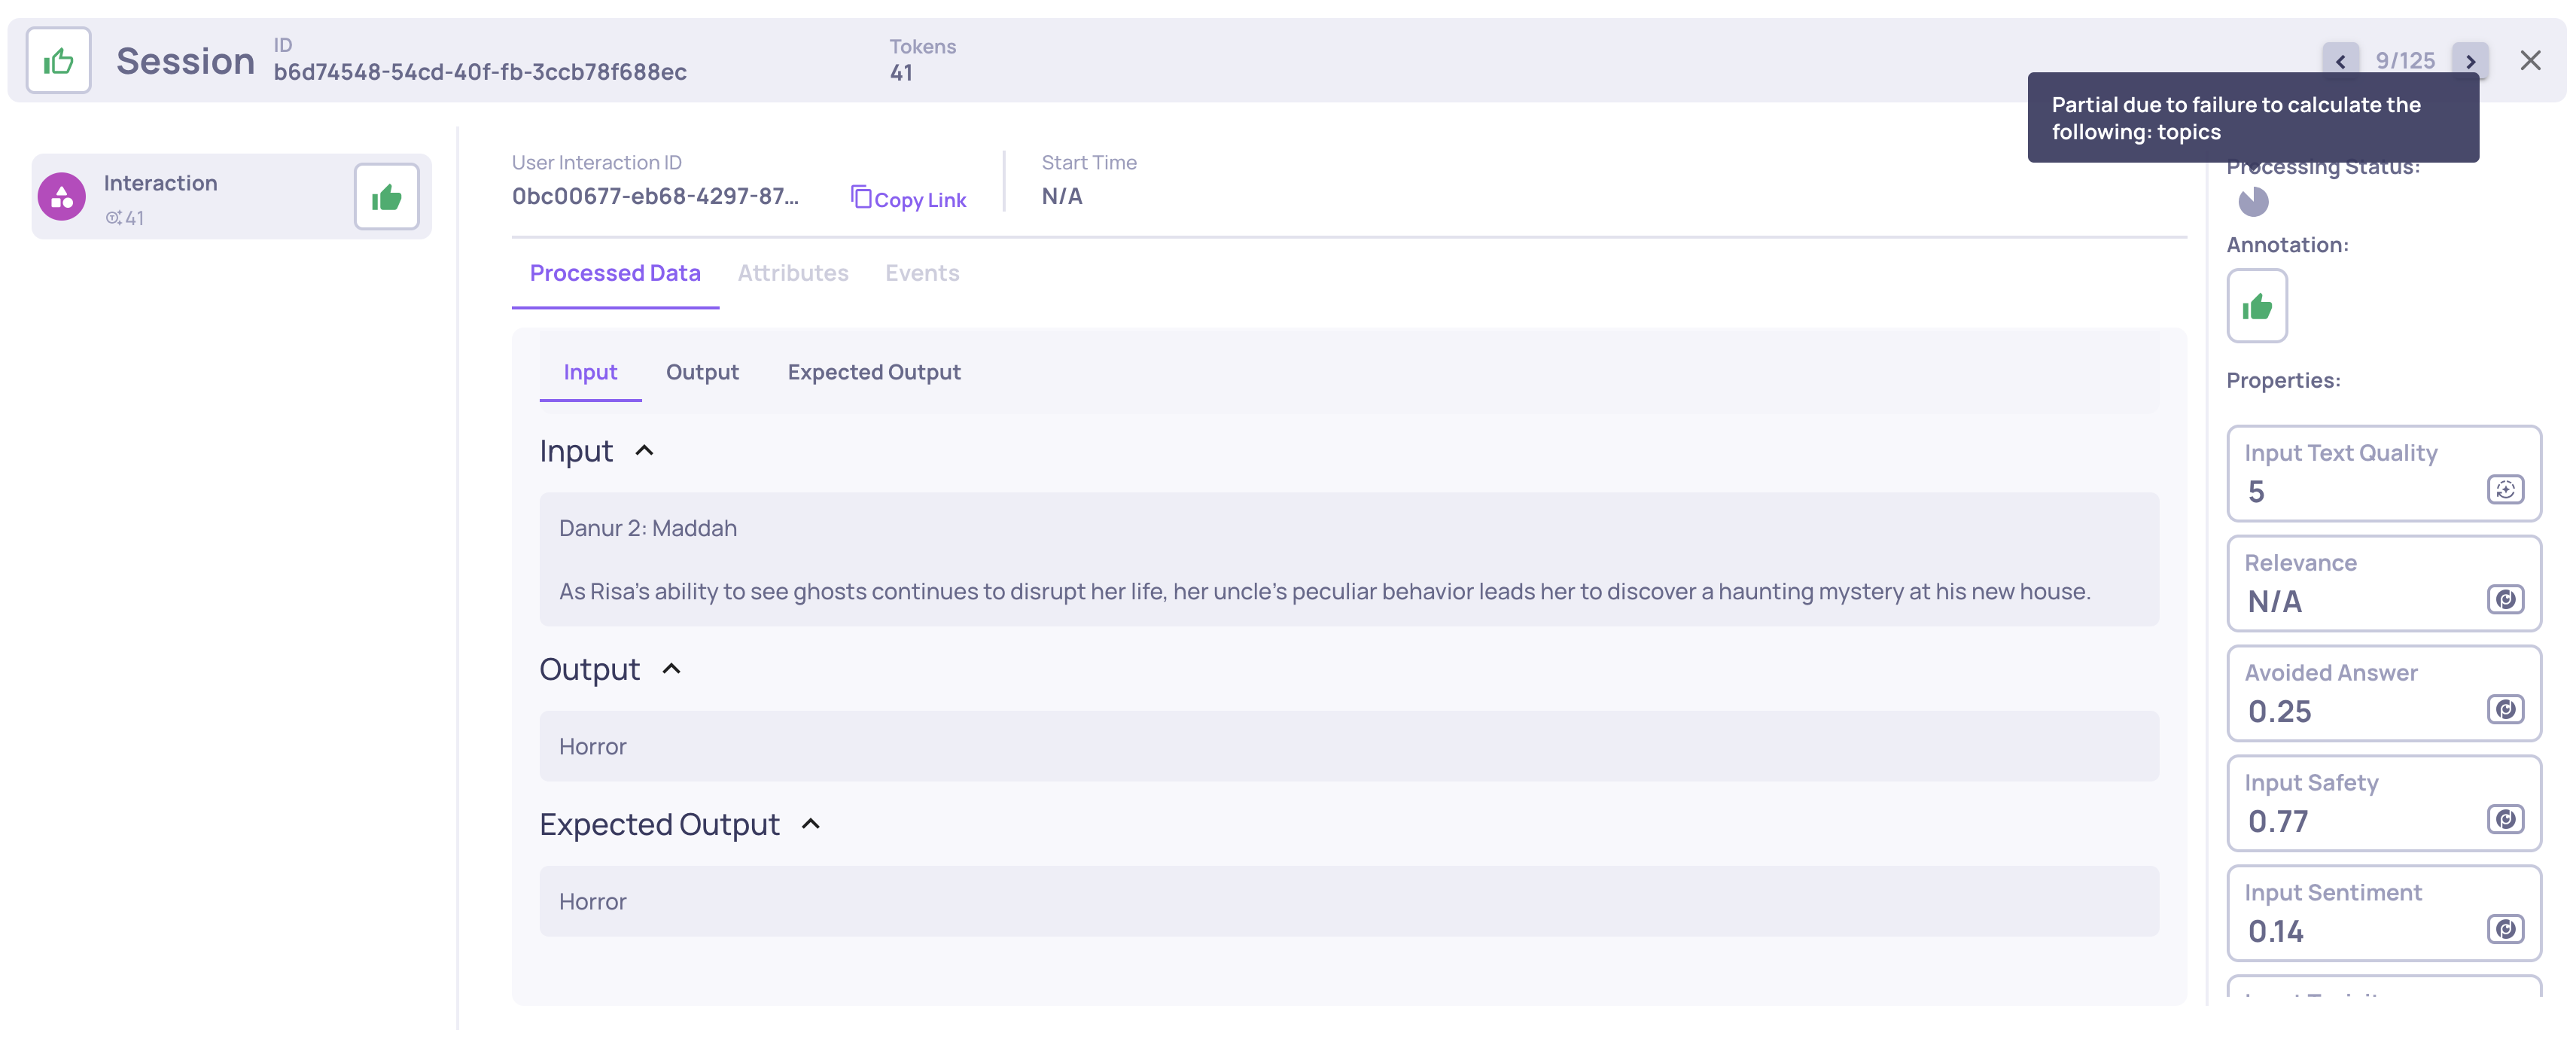
🪟 Persistent Interaction-View Layout
The single-interaction view's divider placement is now persisted per browser. Adjust the panels to fit your workflow once and they'll stay that way across sessions.