0.32.0 Release Notes
11 months ago by Yaron Friedman
We’re excited to introduce enhanced capabilities for production monitoring, version comparisons, failure analysis, and interaction filtering—making it easier than ever to spot trends, identify winners, and focus your evaluations.
Deepchecks LLM Evaluation 0.32.0 Release:
- 📊 New sessions tab and insights in Production overview
- ⭐ Identify better versions and interactions in comparisons
- 📌 “Sticky” versions for easier comparison
- 📝 Custom guidelines for Failure Mode Analysis
- 🎯 Filter interactions by tracing data (tokens & latency)
What's New and Improved?
New sessions tab and insights in Production overview
- The Production environment now includes a dedicated Sessions tab, showing metrics and trends specifically at the session level—complete with score summaries, over-time graphs, and a detailed session list.
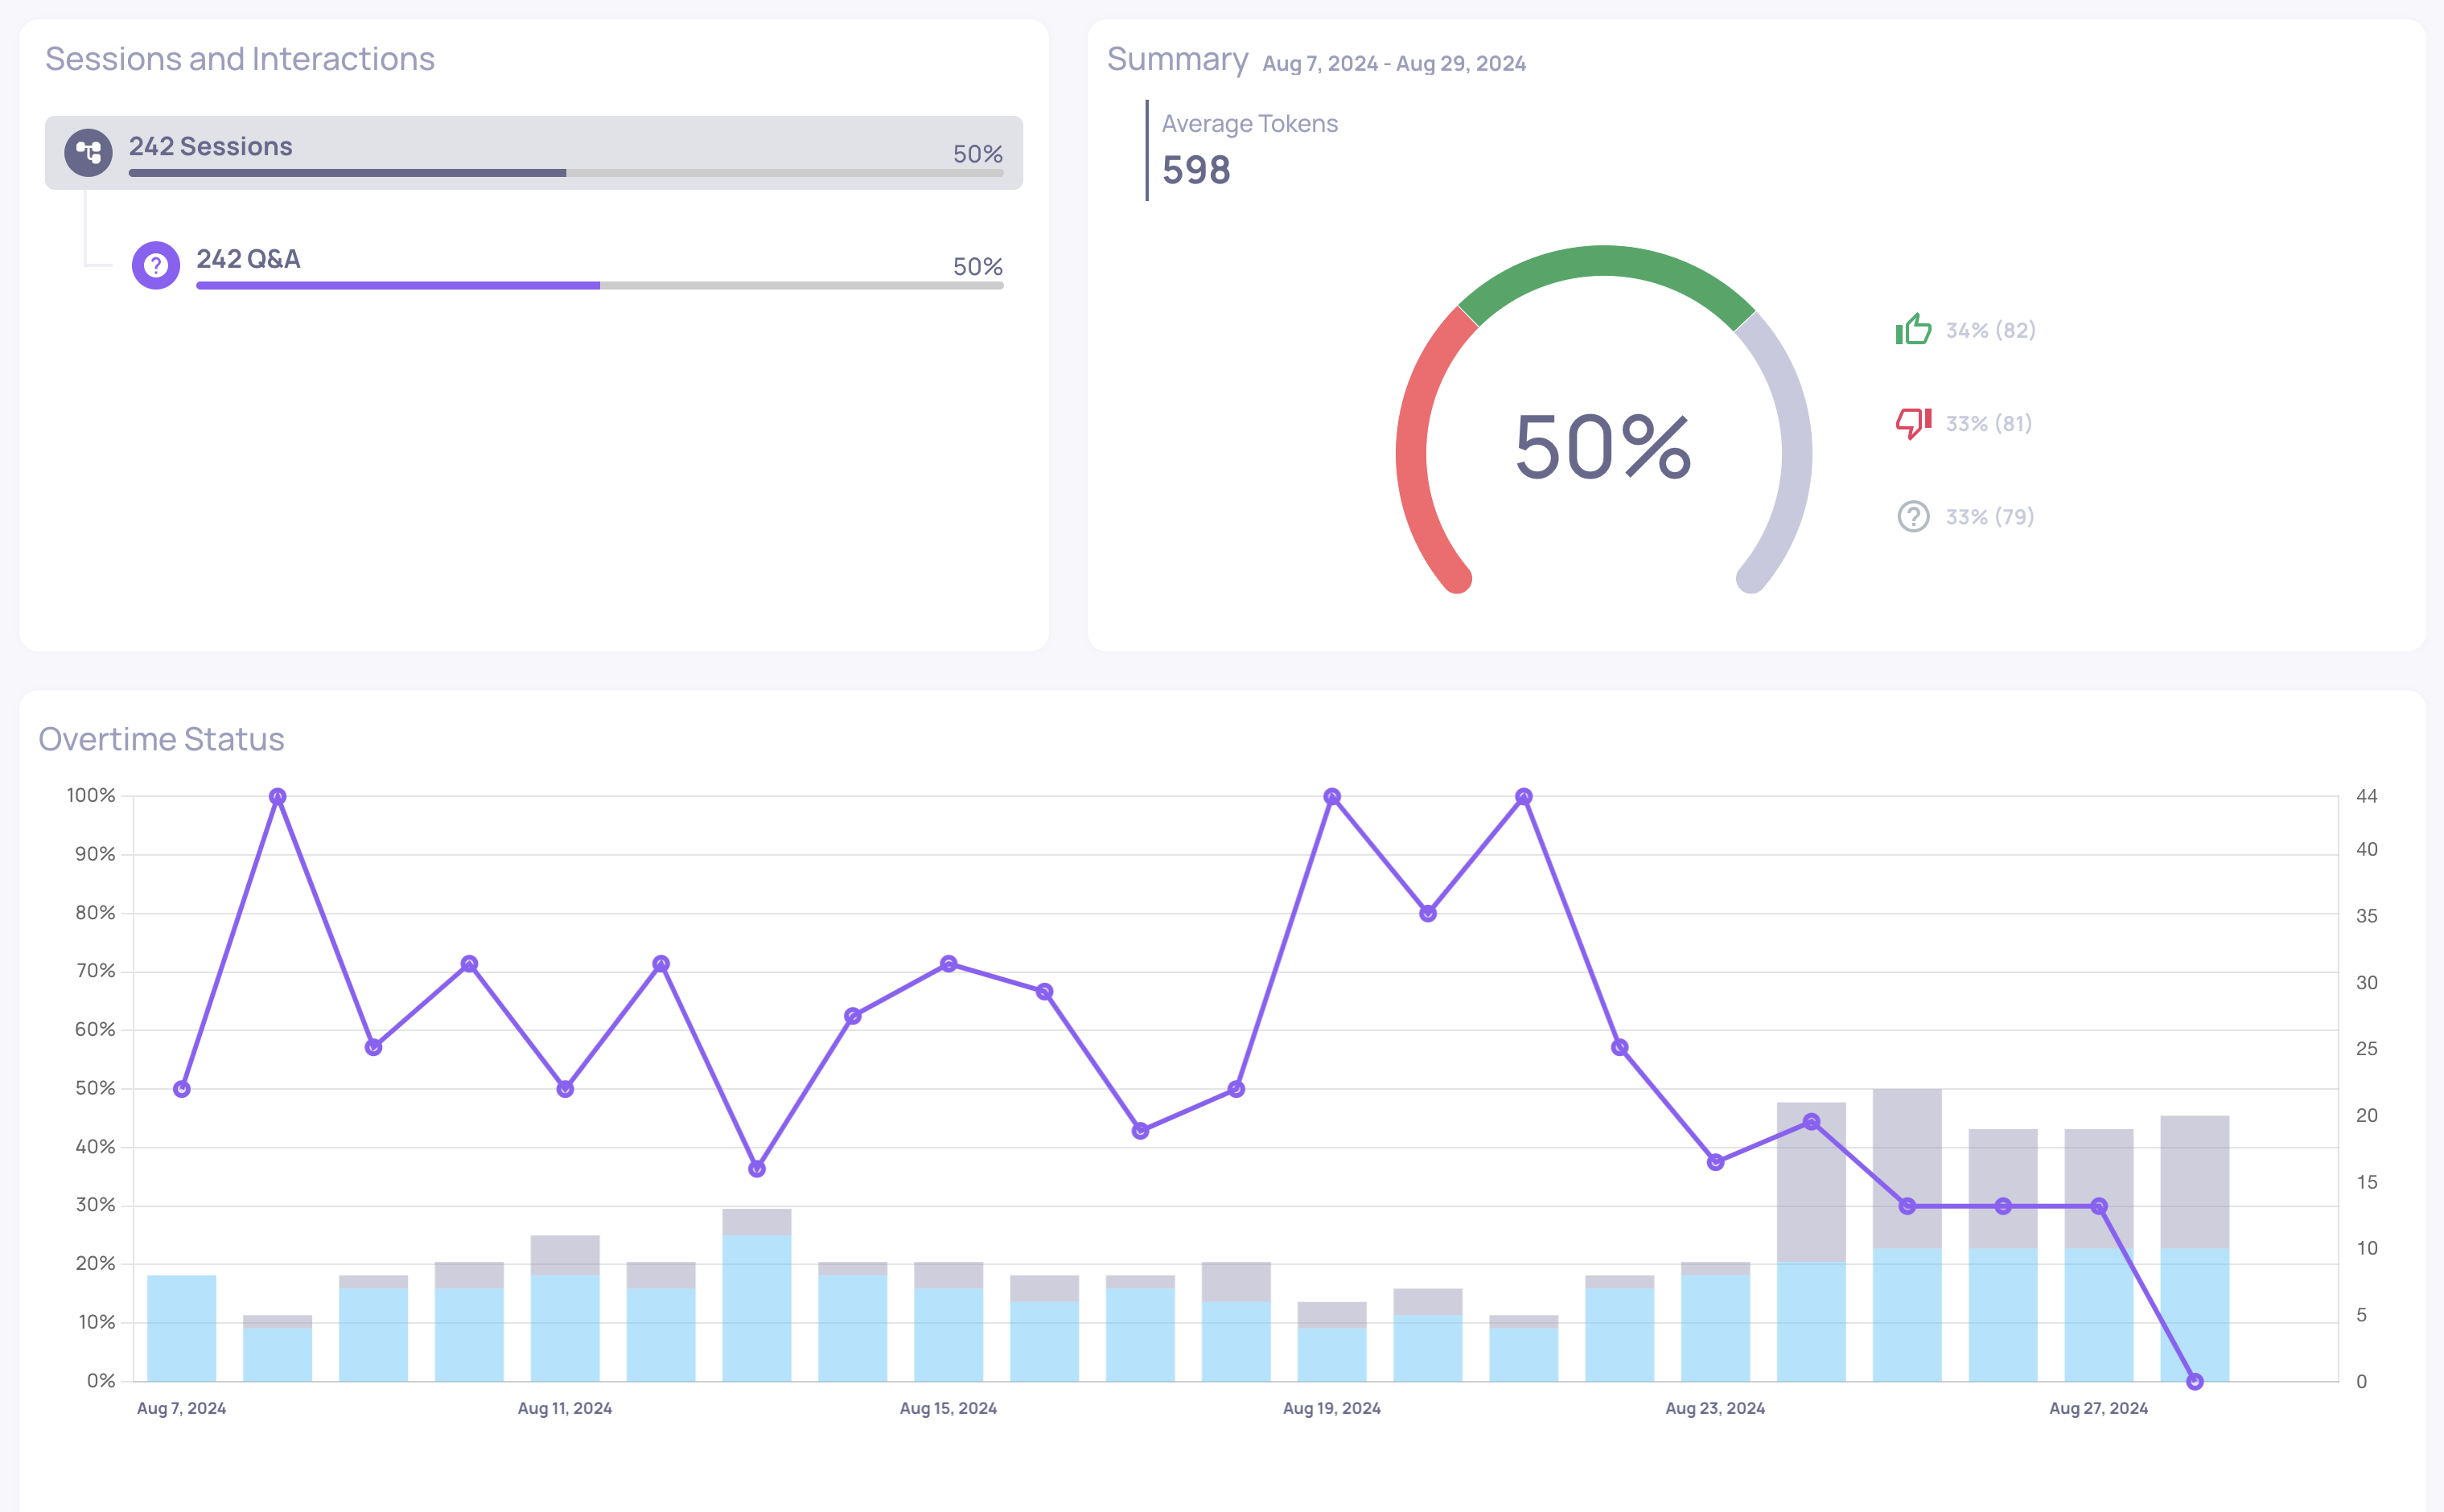
Sessions tab in Production environment view
- We’ve also added time-range-aware insights to Production. Simply adjust the global time-range filter, and your insights will update accordingly—helping you focus on recent data or specific time periods of interest.
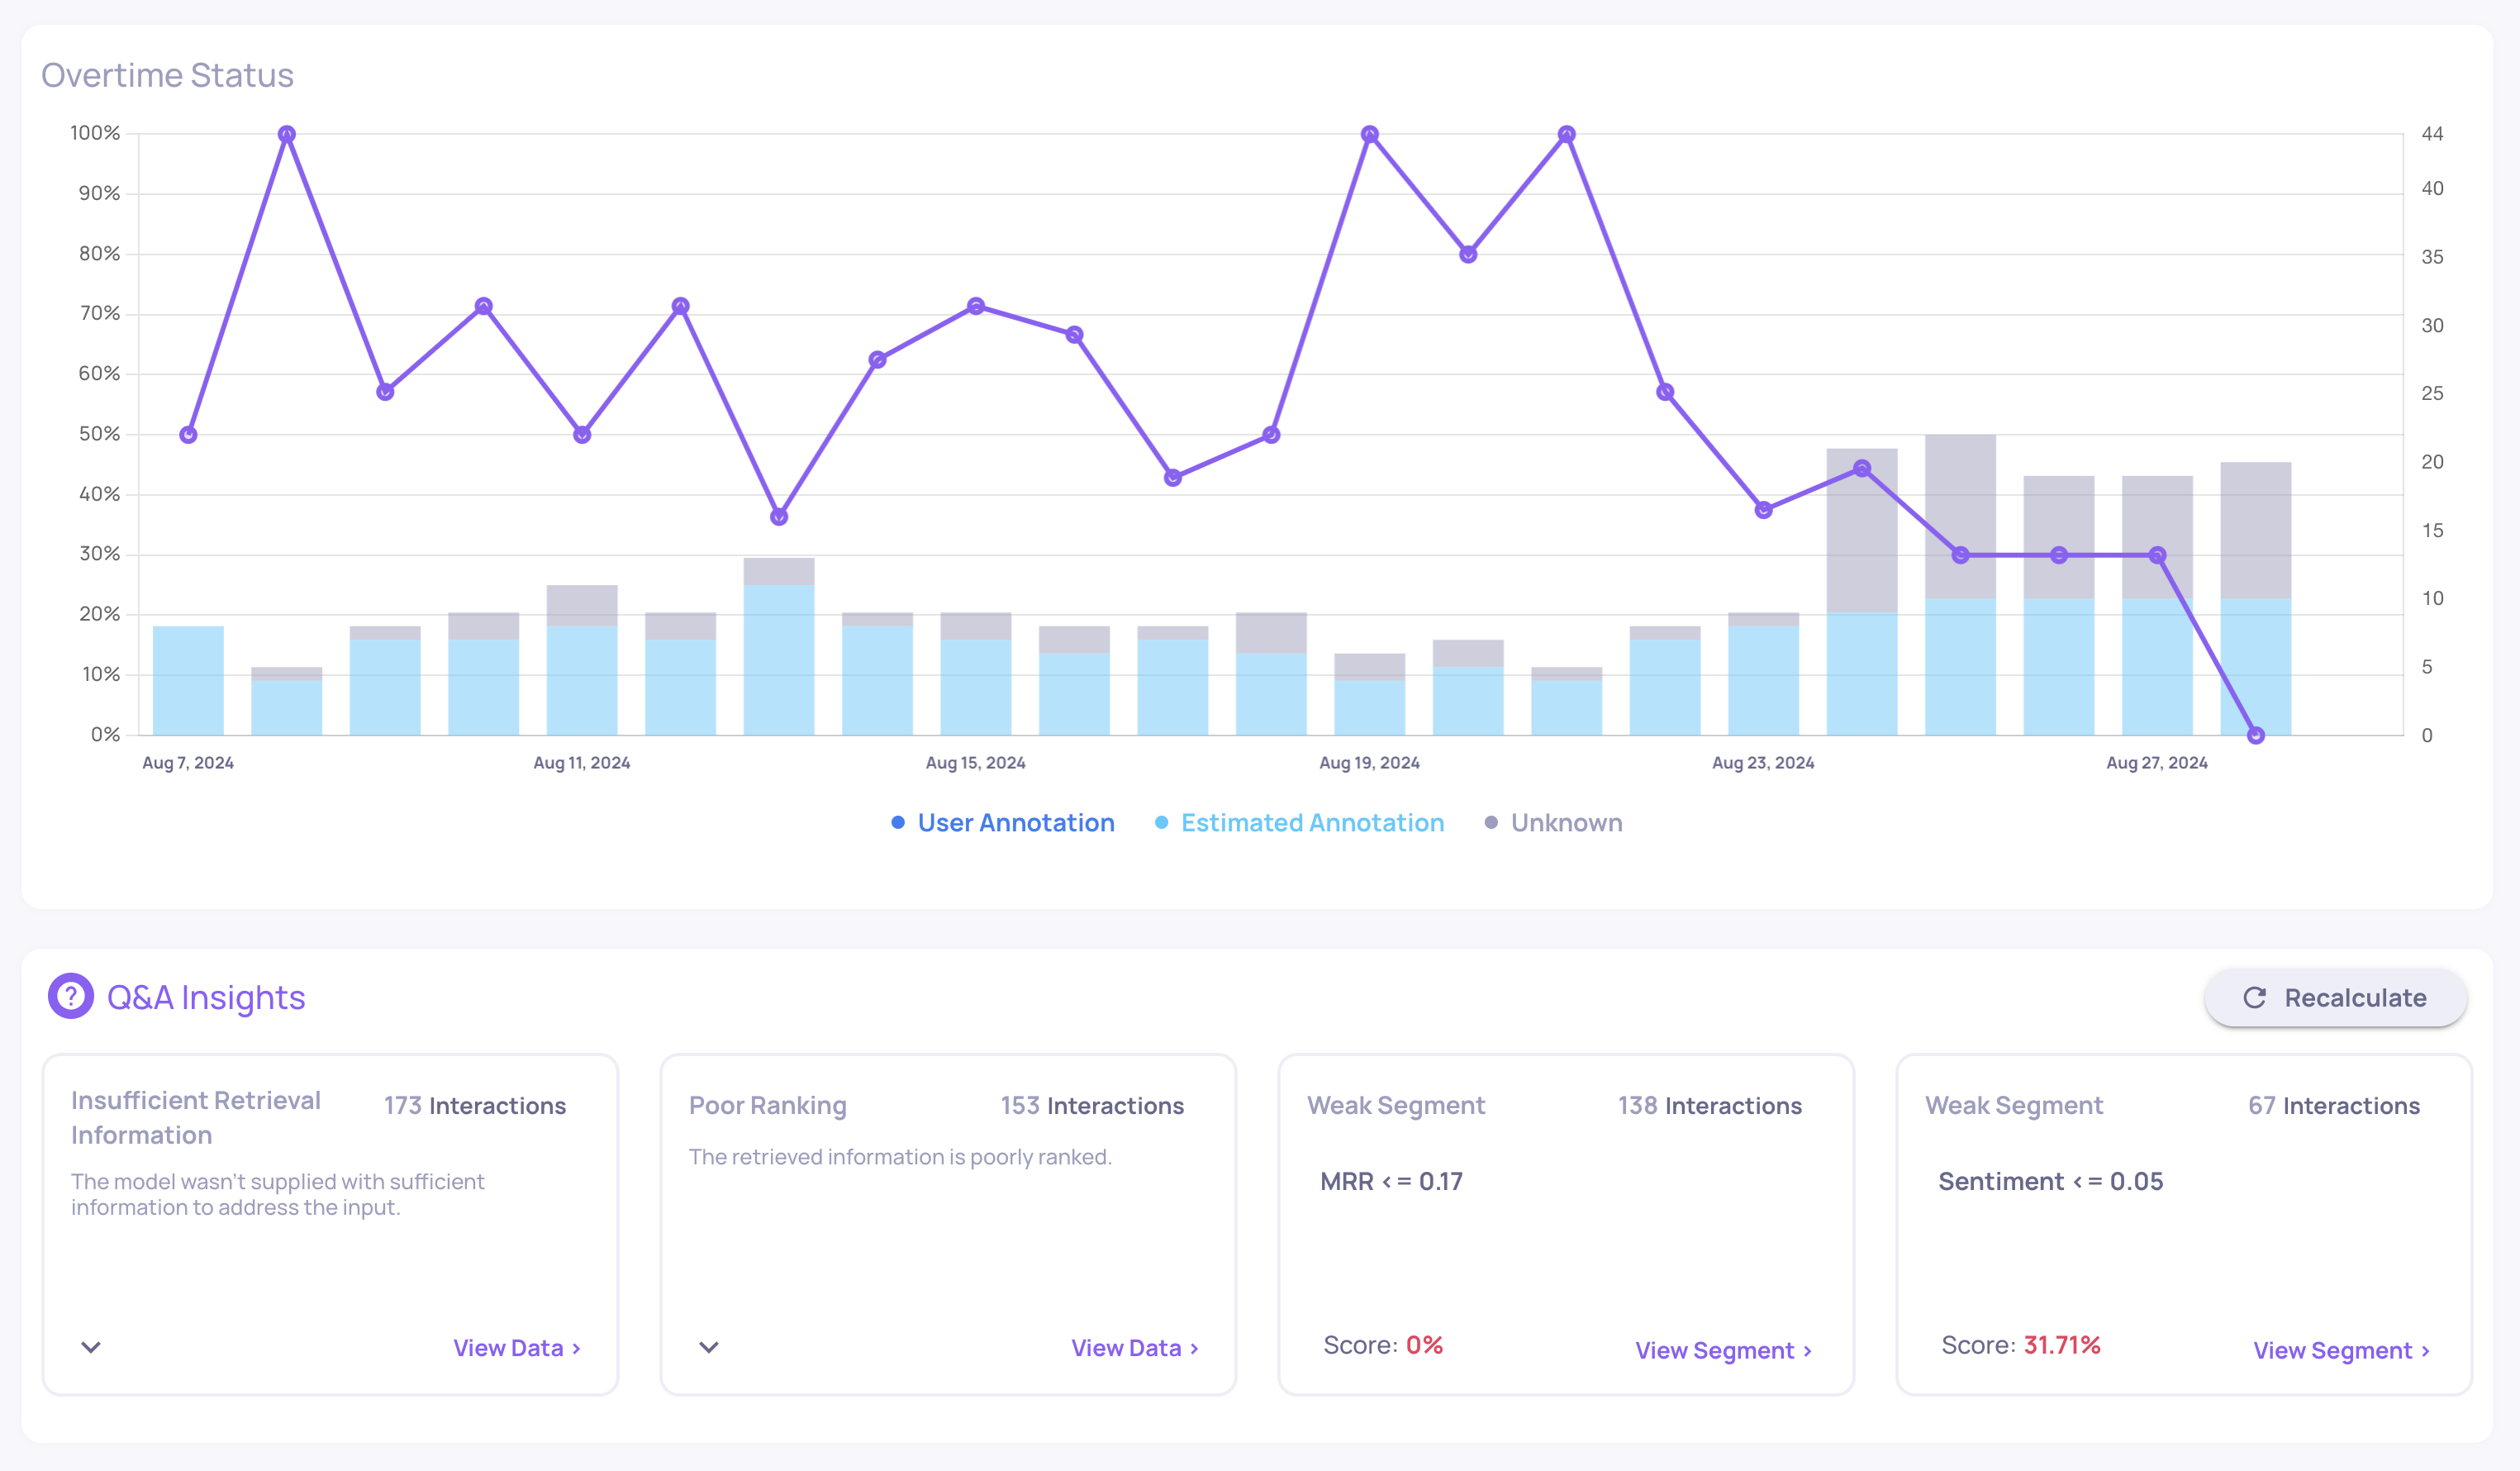
Time-range aware insights in Production environment view
Identify better versions and interactions in comparisons
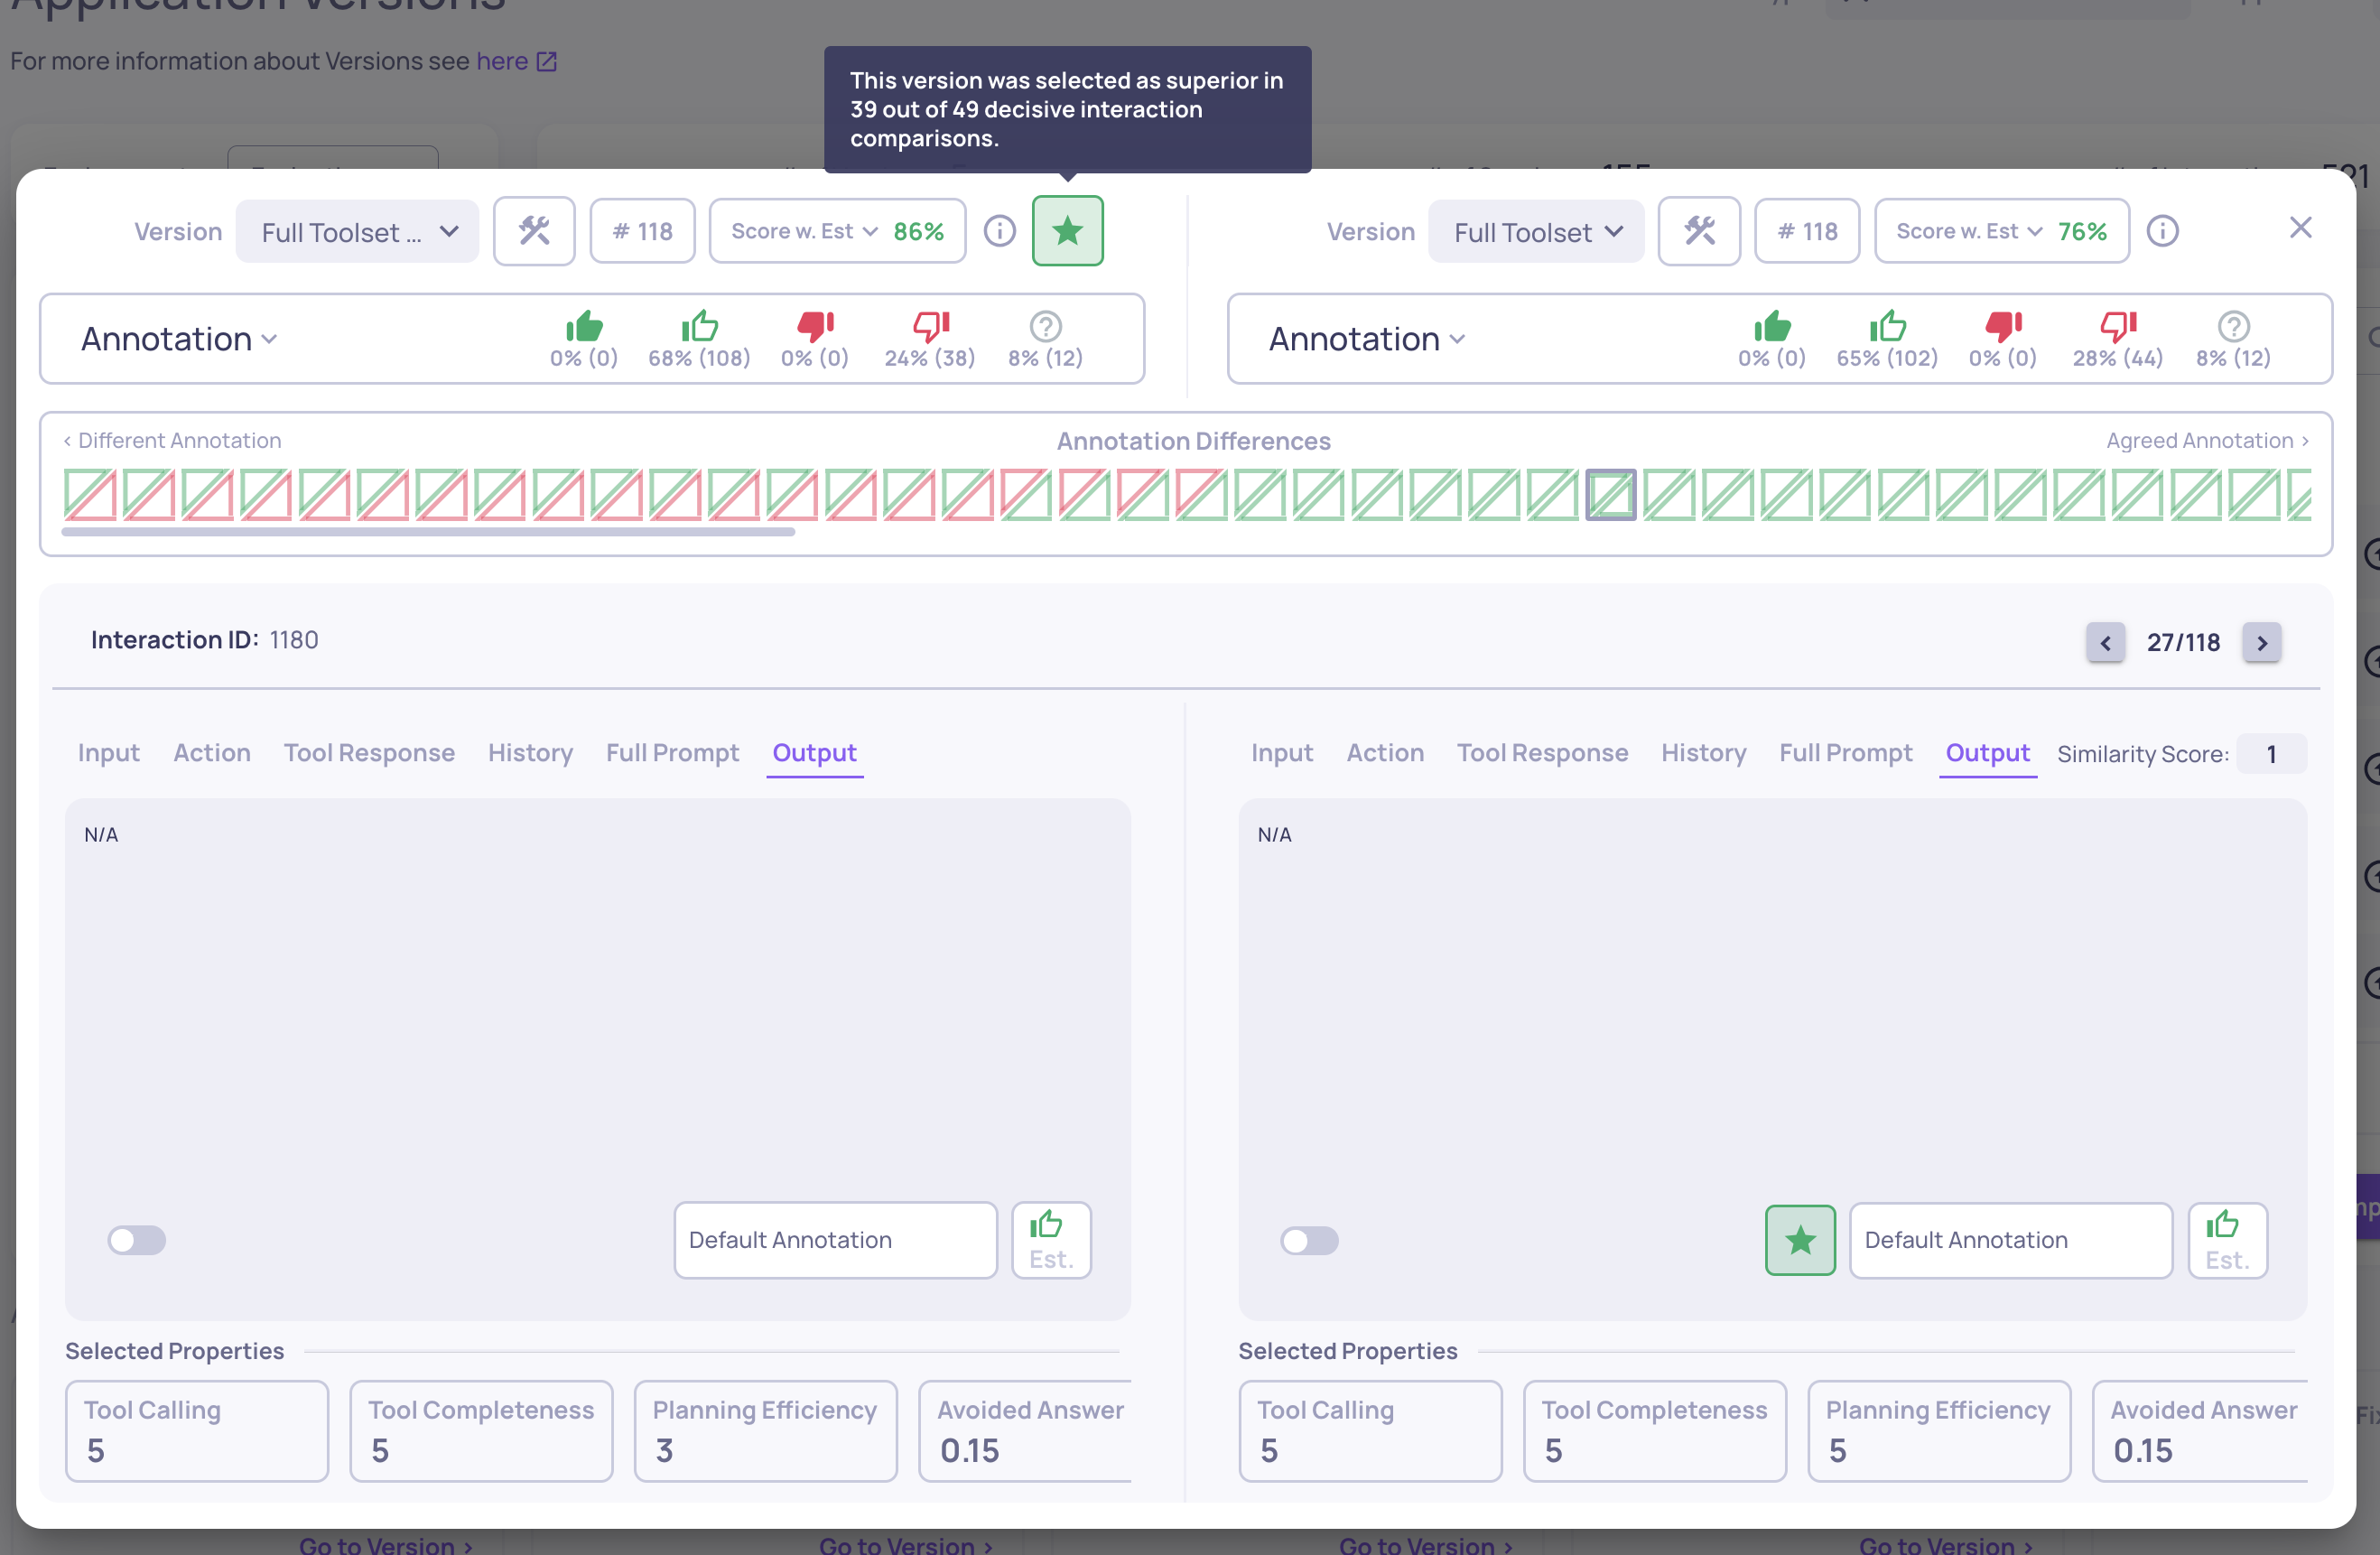
- The version comparison view now highlights which version—and which specific interactions—perform better, based on numerical property analysis.
- Interaction-Level Star Indicator: Each interaction pair is evaluated using the average of the first three pinned numerical properties (often your most critical metrics). The higher-scoring interaction gets a star, and ties get stars for both.
- Version-Level Star Indicator: The version with a majority of “better” interactions earns a star, giving you an at-a-glance winner.
- Hover for explanation: Tooltips clarify the reasoning behind each star selection.
“Sticky” versions for easier comparison
- You can now pin (“stick”) versions to the top of the Versions screen by clicking the up-arrow icon next to them. This keeps them in view while you sort, filter, or explore other versions—perfect for focusing on a few key versions.
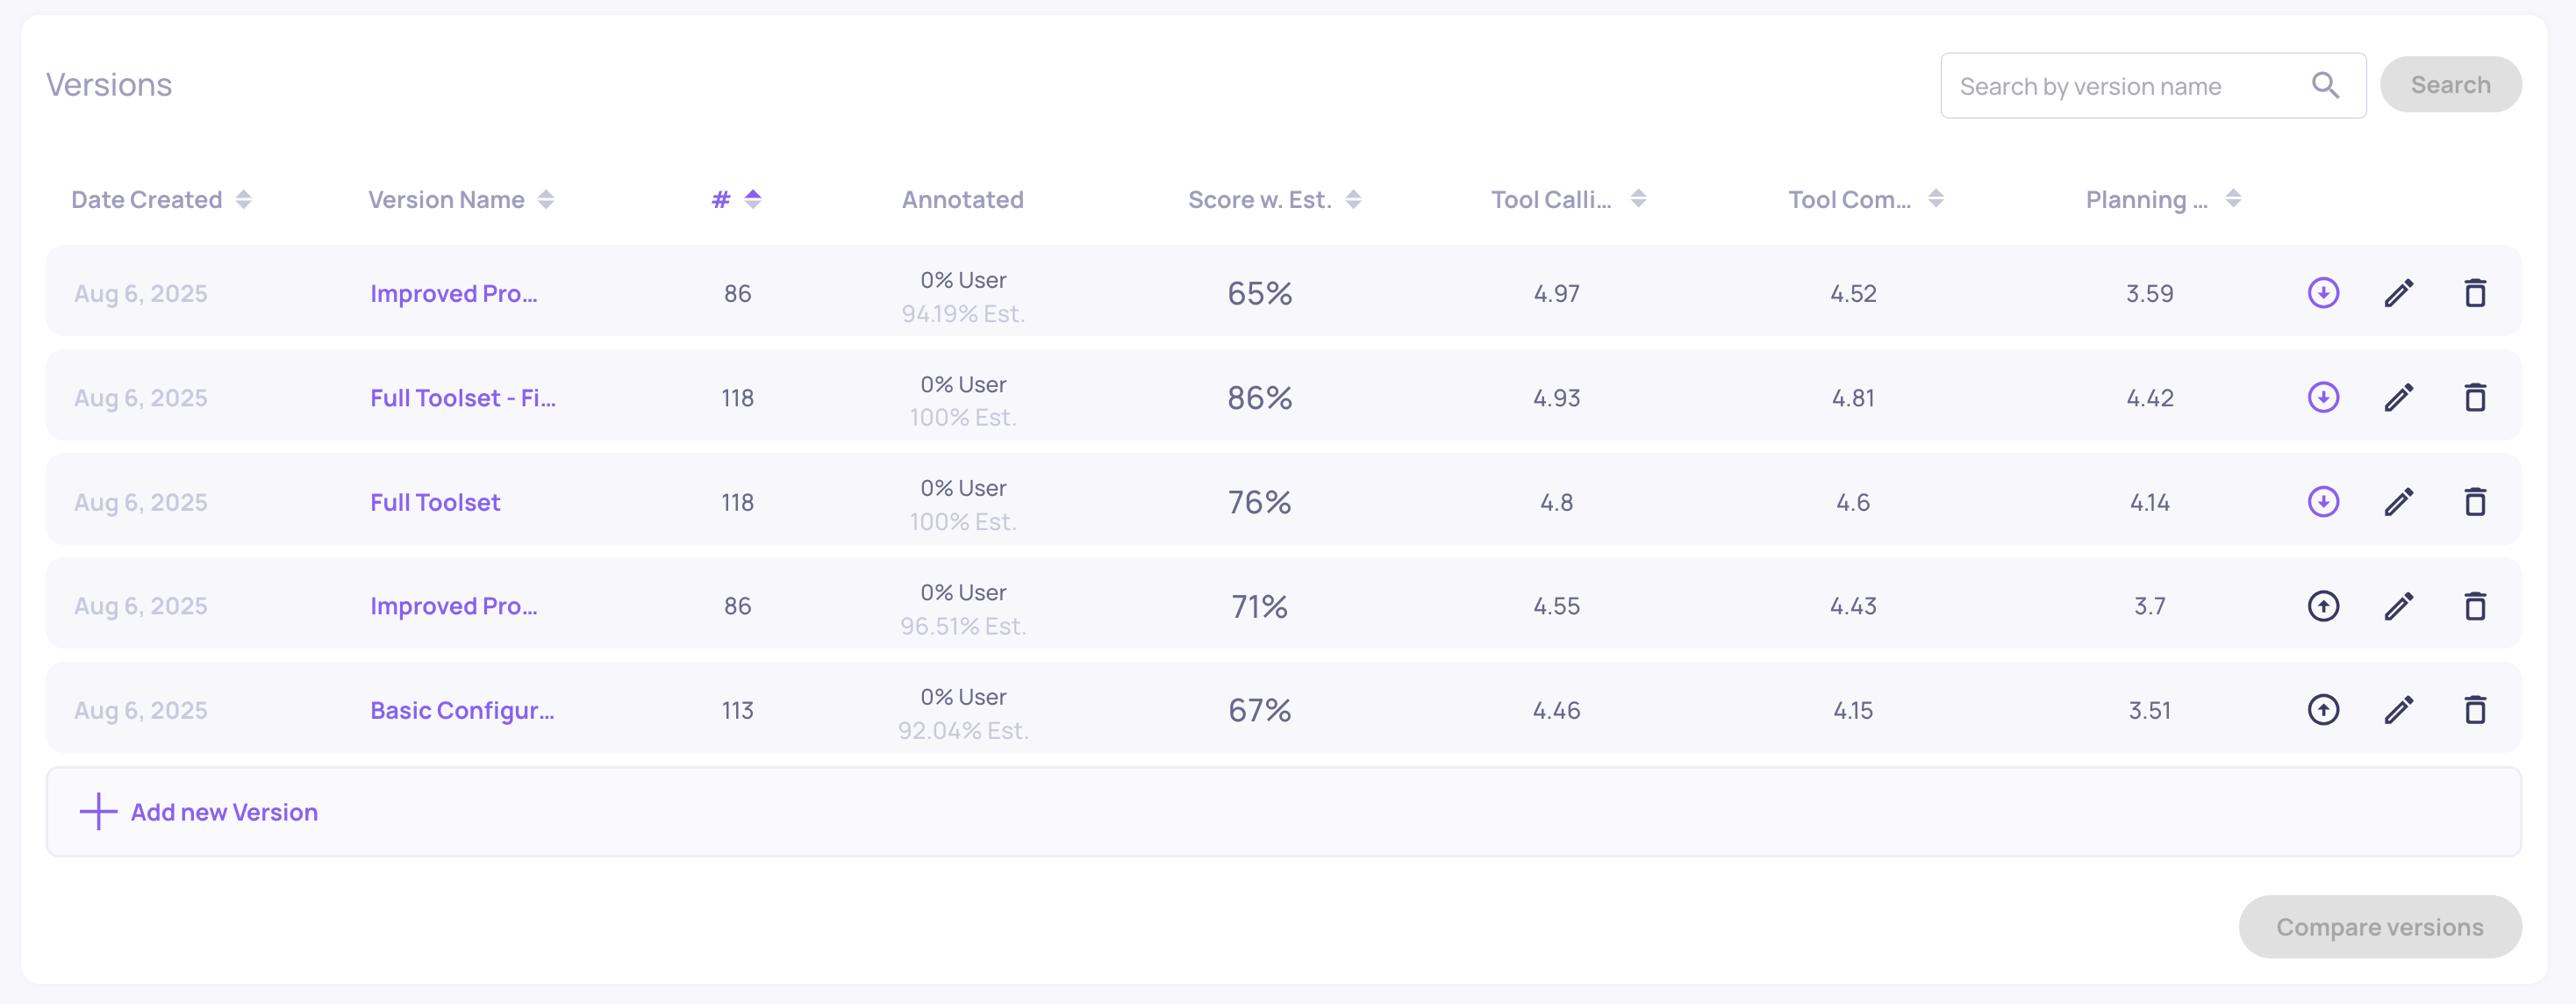
"Sticky" versions feature
Custom guidelines for Failure Mode Analysis
- Failure Mode Analysis now supports user-provided guidelines. You can supply assumptions, suspected failure modes, or specific areas of concern for the analysis agent to focus on—helping tailor summaries to your specific evaluation goals.
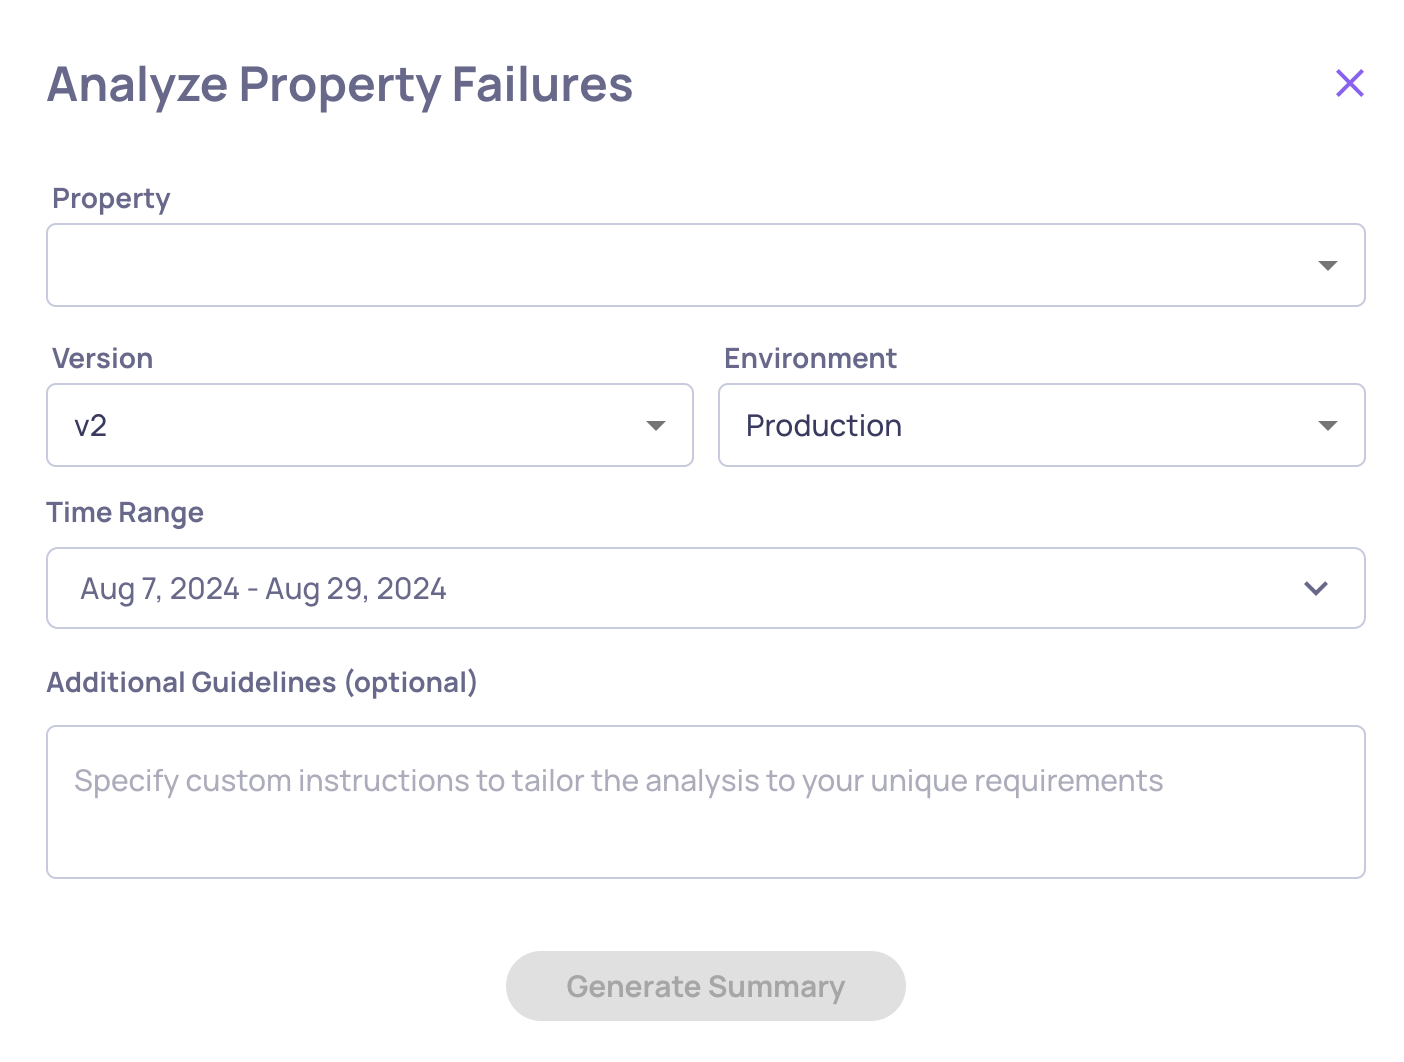
Option to add user-provided guideline before analyzing property failure modes
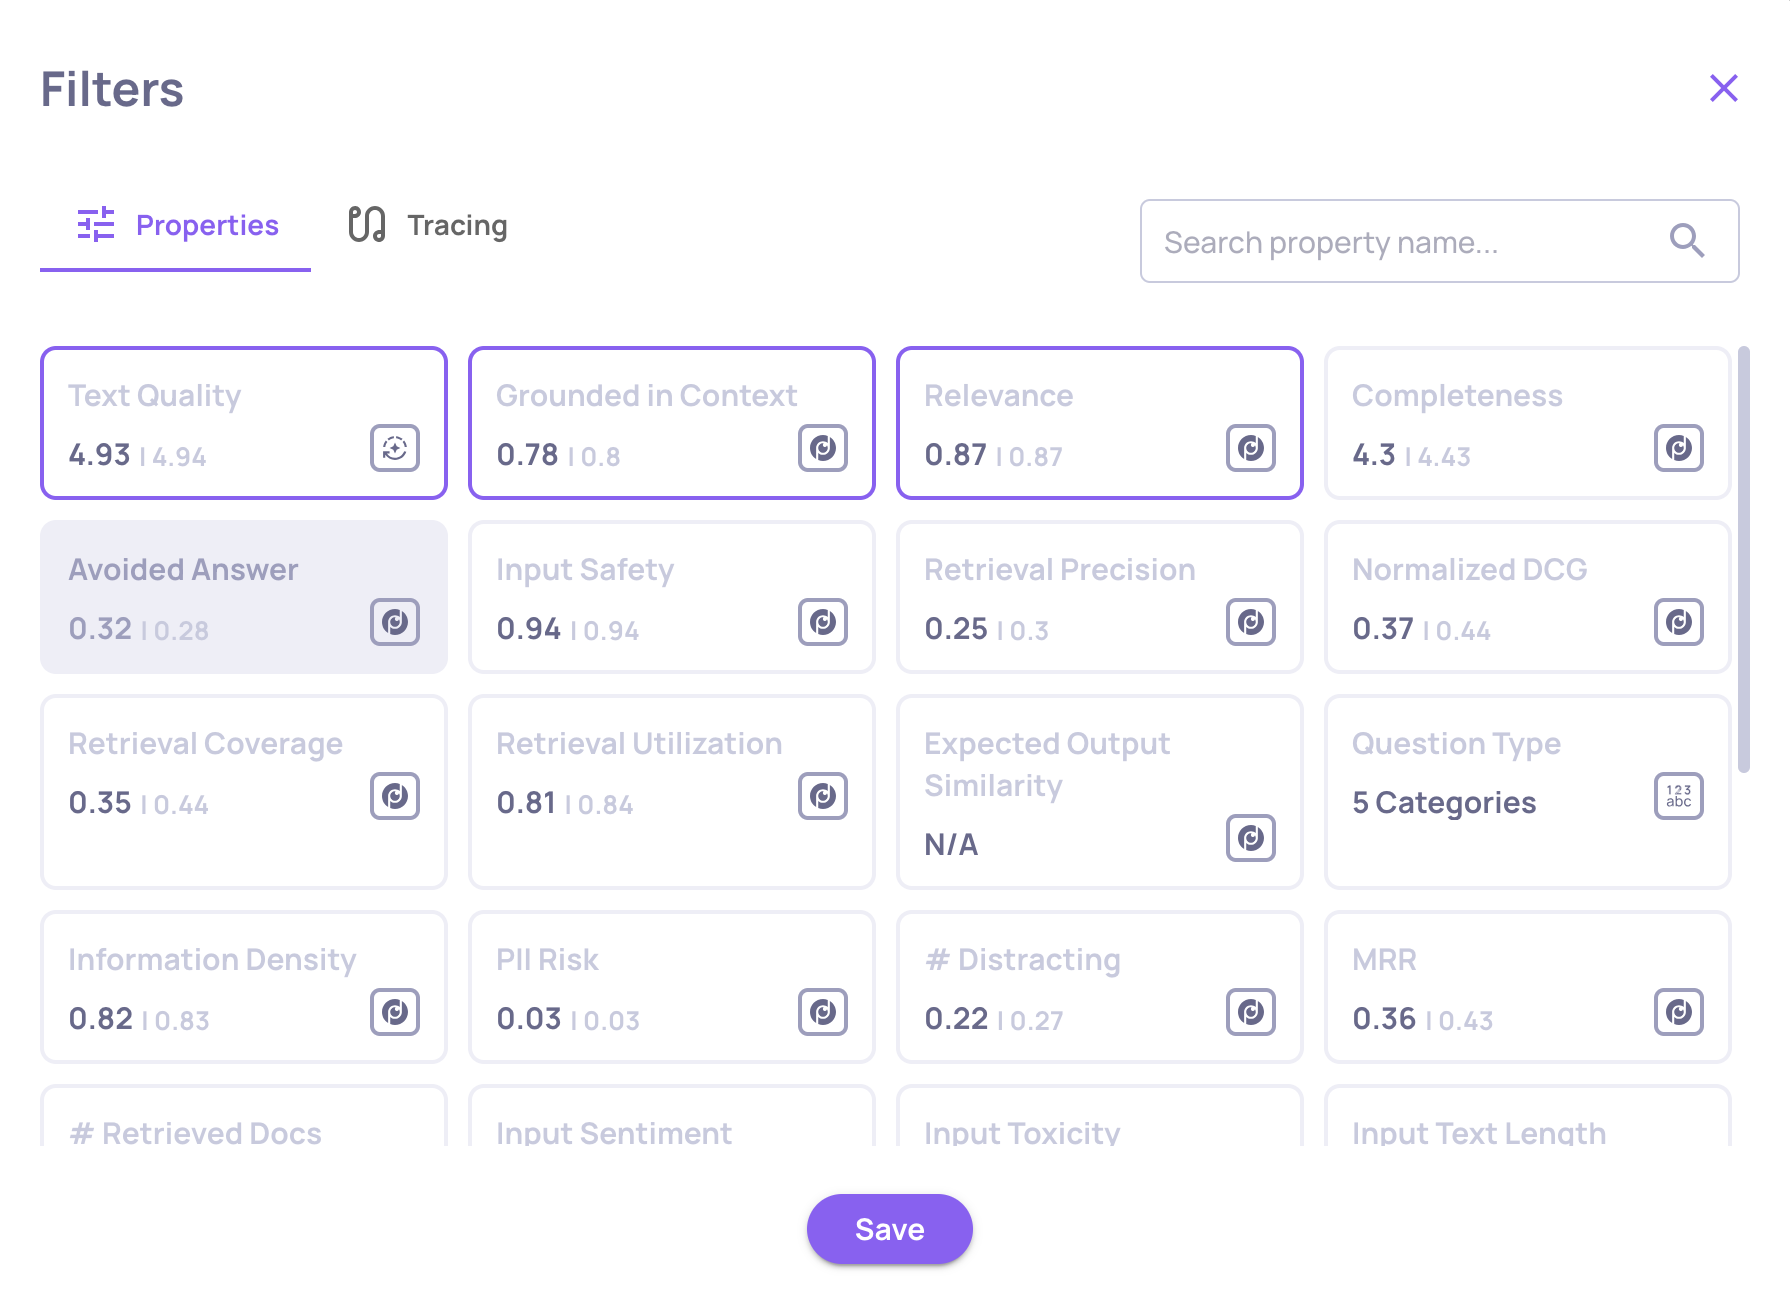
Filter interactions by tracing data
- The Interactions page now includes filters for tracing-based system metrics such as total tokens and interaction latency—making it easier to investigate performance patterns or anomalies linked to system behavior.