0.34.0 Release Notes
This release focuses on flexibility, observability, and deeper insights: evaluate multi-agent workflows, simplify trace logging, tailor performance to your setup, and keep control with new filters and organization-wide logs.
Deepchecks LLM Evaluation 0.34.0 Release:
- 🤖 Advanced support of agent evaluation (including nested interactions, new interaction types, child-aware properties and CrewAI integration)
- 📡 Trace logging with instrumentation
- 🎛️ Configurable processing speed for AWS SageMaker & On-Prem deployments
- 🔖 Save filter presets for quick navigation
- 📊 Version Comparison CSV Export
- 🗂️ Organization-level logs across applications
What's New and Improved?
Advanced support of agent evaluation
We’ve significantly expanded our observability and evlauation support for agentic workflows - across frameworks, tracing methods, and evaluation:
- New interaction types (Root, Agent, LLM, Tool), each with research-backed built-in properties and auto-annotation configurations.
- New built-in properties tailored for agents and tools, including Plan Efficiency, Tool Coverage, and Tool Completeness.
- Nested spans & interactions, with properties that leverage child data for richer evaluation.
- Enhanced UI for single-trace view, showing run status, logged system metrics, attributes, and events - making debugging and analysis more transparent.
- Seamless framework support: thanks to our new OpenTelemetry tracing (see the following item), agent frameworks like CrewAI can now be logged and evaluated directly.
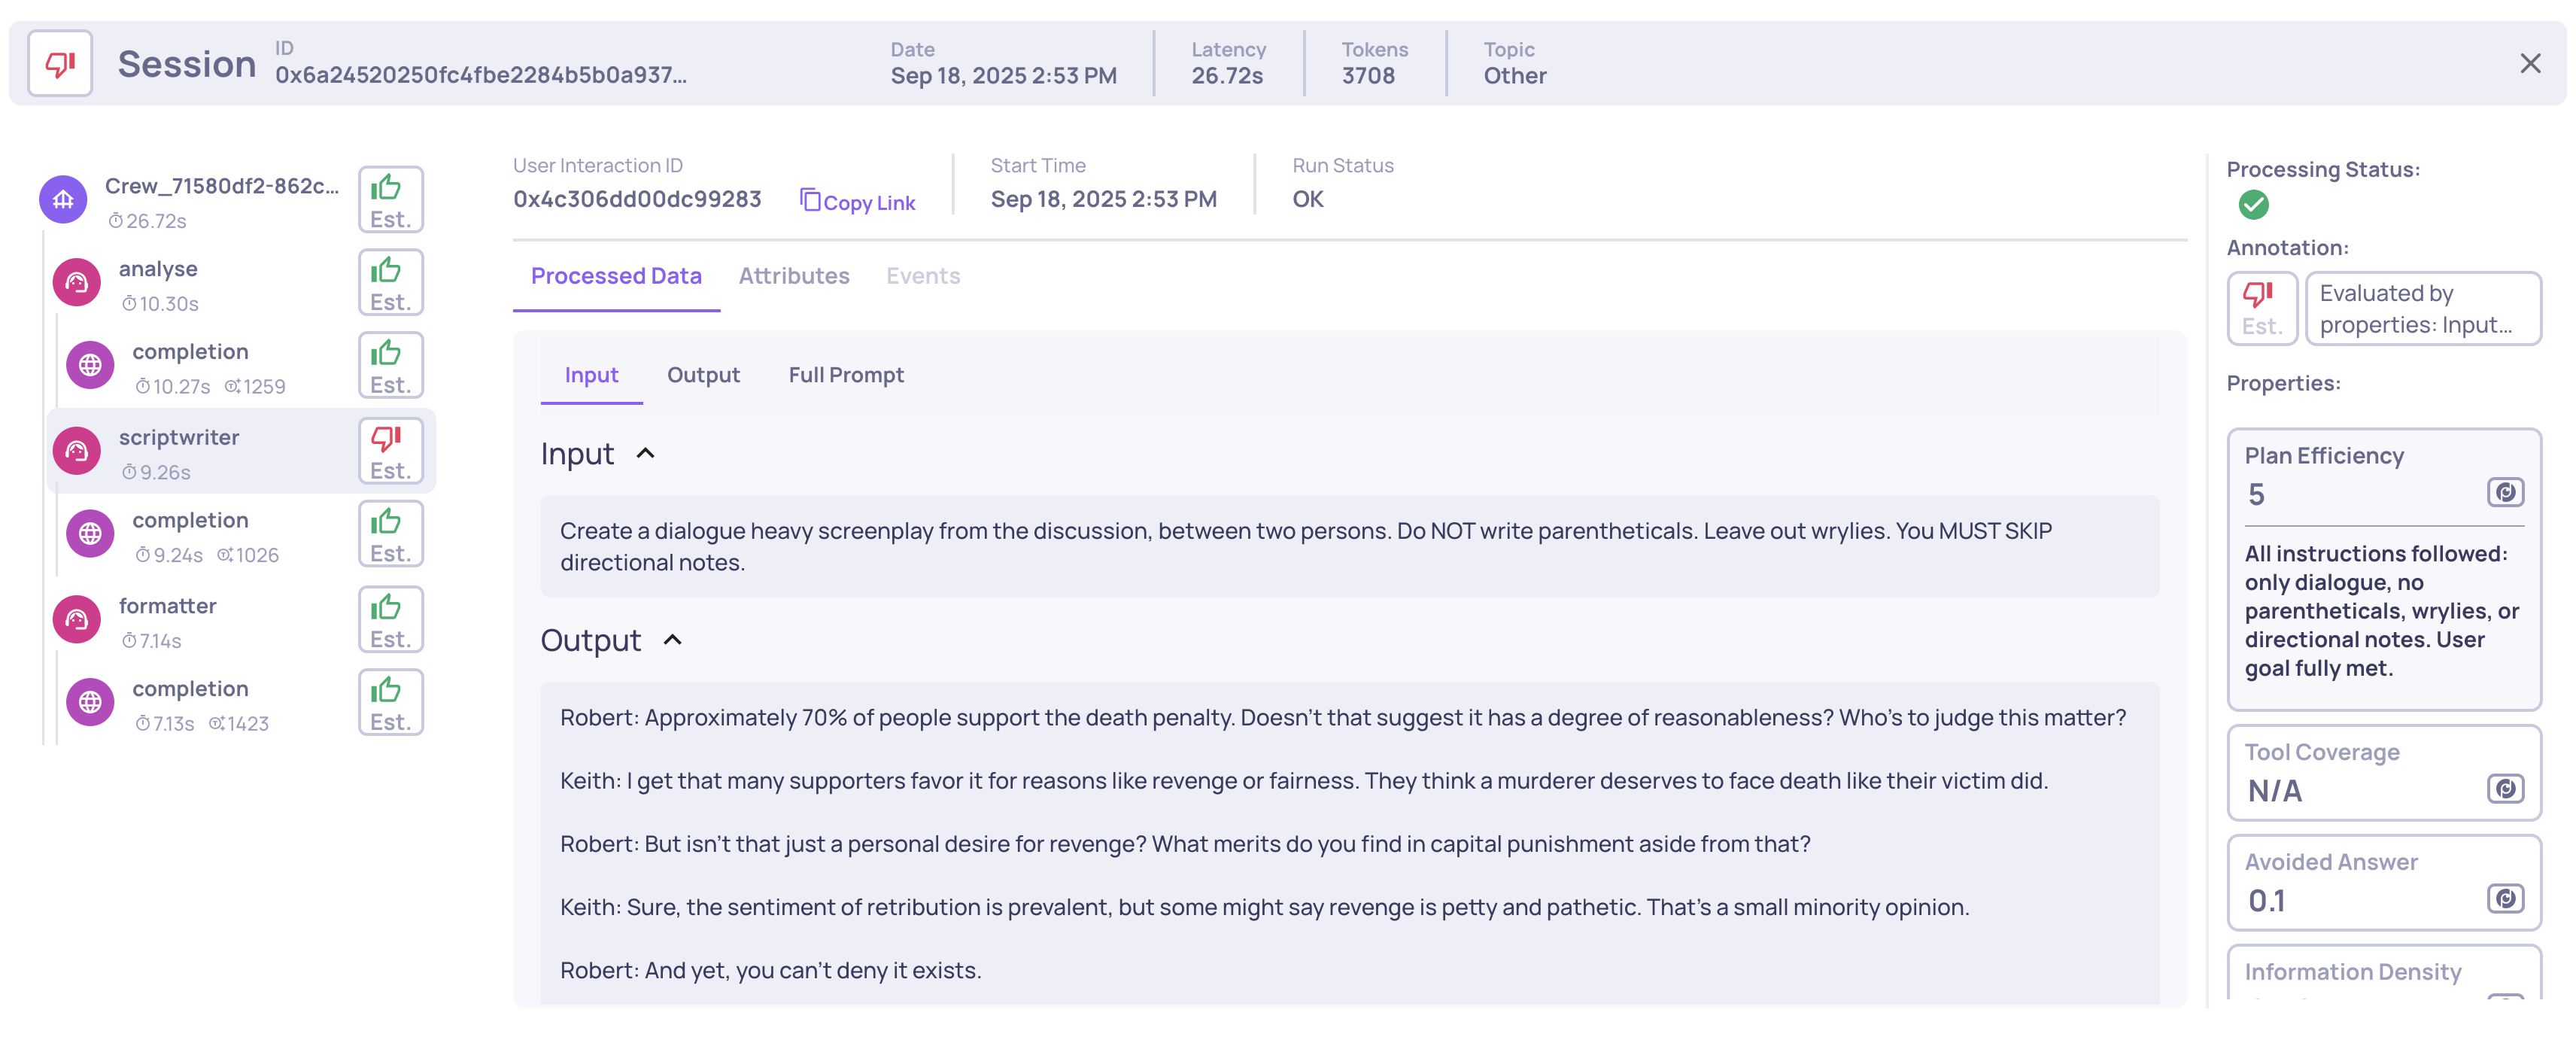
Example of a the new single Agent span view
Trace logging with instrumentation
We’ve just introduced native support for trace logging via OpenTelemetry and OpenInference 🎉.
Now, you can automatically capture and centralize traces and spans from your LLM and agentic frameworks into Deepchecks - no more manual logging required. If you’re already using frameworks with built-in instrumentors (like CrewAI, LangGraph, and others), setup is seamless and requires only a few lines of code for configuration.
This makes it easy to collect rich, structured trace data from your agents and pipelines, and immediately make it available for:
- Evaluation: Run properties and analyses directly on trace-level data.
- Monitoring: Keep track of performance across workflows.
- Debugging: Quickly drill down into problematic spans, traces and versions.
This ensures you get the deepest possible visibility with minimal effort.
Configurable Processing Speed for Deepchecks On-Prem & SageMaker products
For our non-SaaS deployments, evaluation speed depends on your own LLM capacity. To reduce rate limits and bottlenecks, you can now choose between three processing modes—fast, balanced, or reduced load - so evaluations always complete smoothly at the pace that fits your setup.
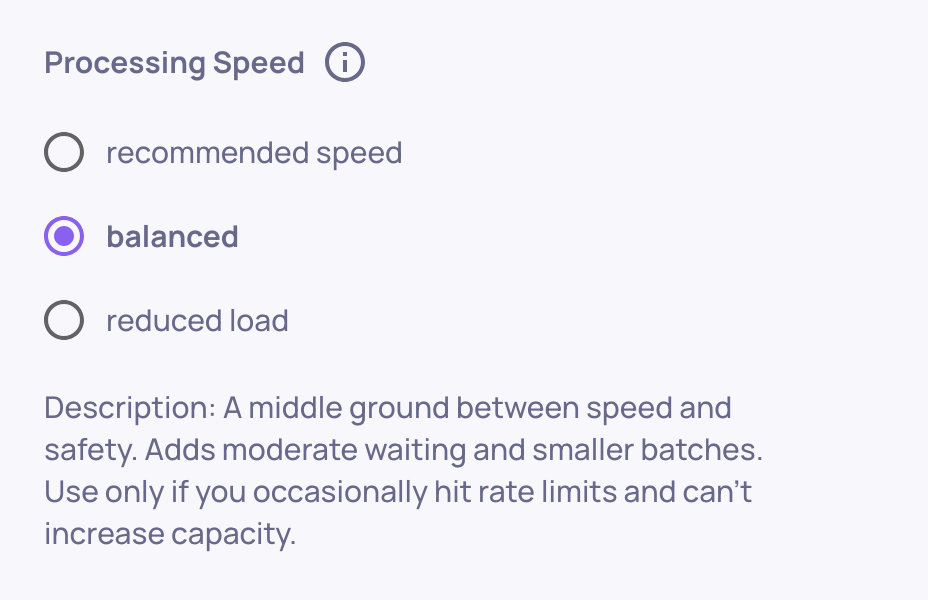
Changing the processing speed on the Workspace Settings screen
Save Filter Presets for Quick Navigation
Tired of reapplying the same filters and sorts? You can now save your setup as a preset on the Interactions screen, then reload it with a single click. This makes it effortless to jump back to your most useful views and keep analyses consistent across sessions.
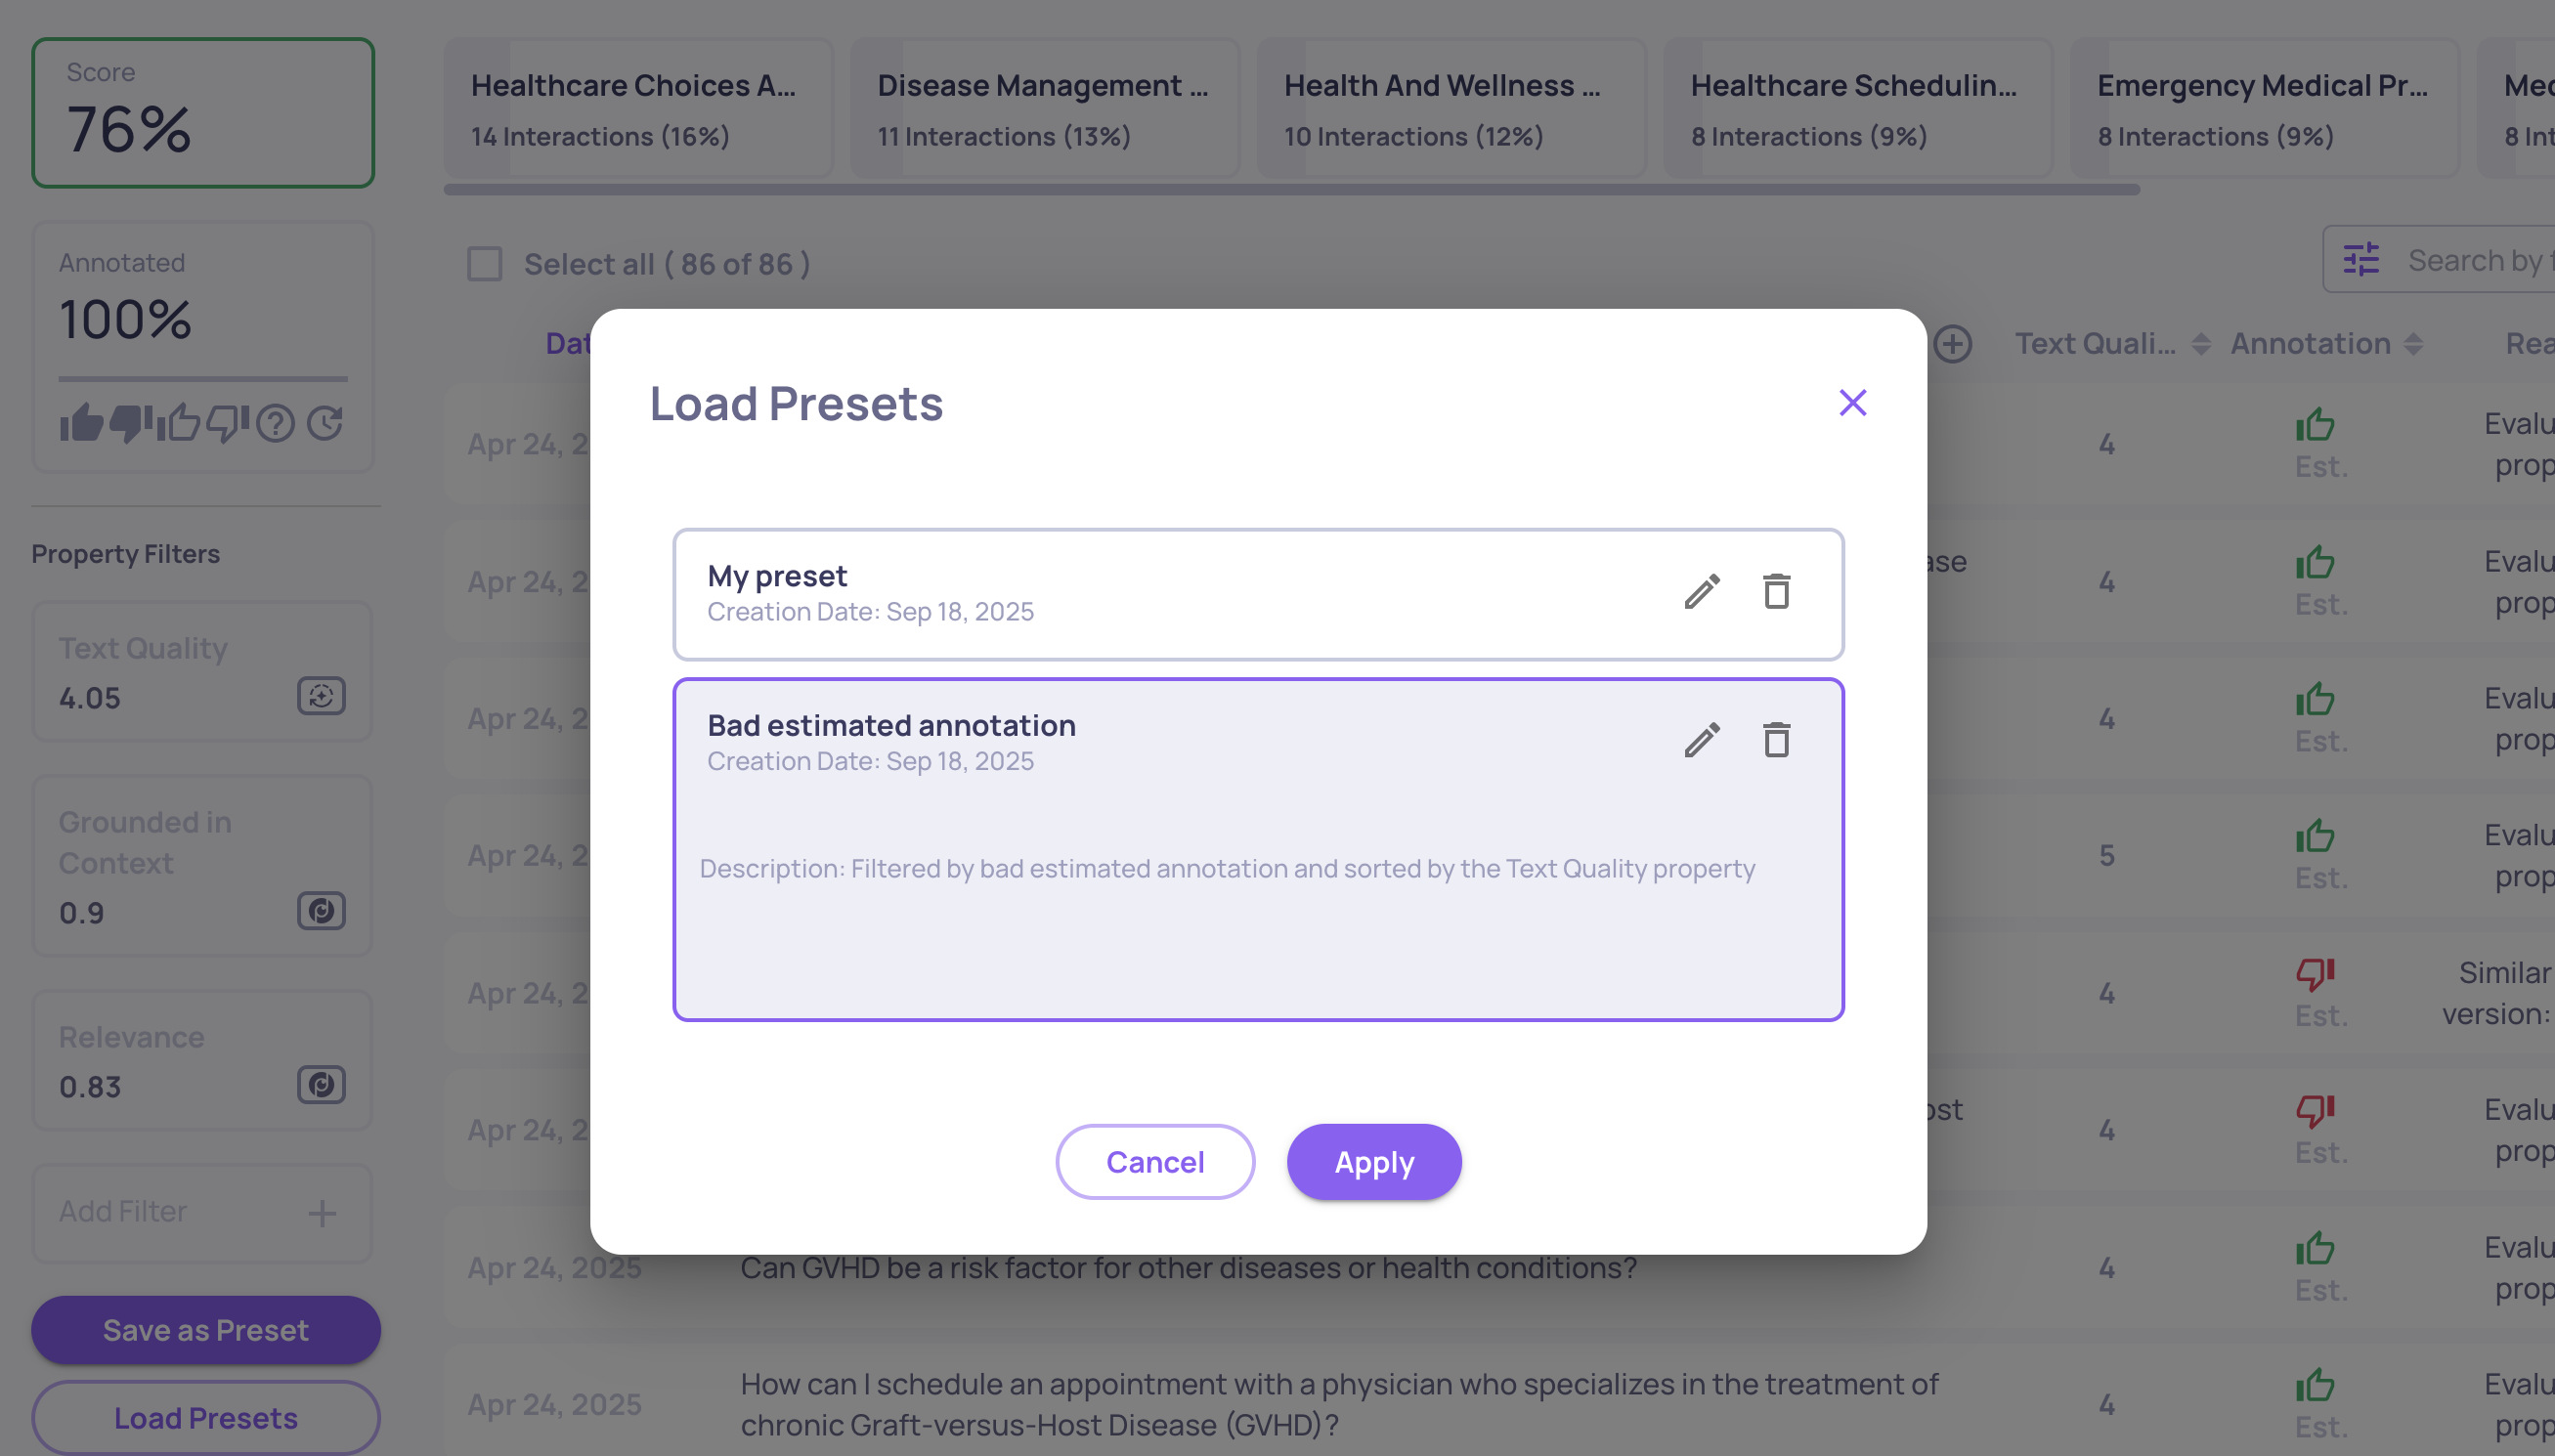
Loading a save preset on the interactions screen
Version Comparison CSV Export
Need to take your version comparisons beyond the UI? You can now export comparison results directly to CSV for deeper analysis.
- Review all selected versions side by side.
- Access details like overall performance, system metrics, and property-level breakdowns.
- Extend analysis using your own tools - filter, aggregate, or merge with external data sources.
This makes it simple to share results across teams and continue working in the format that best fits your workflow.
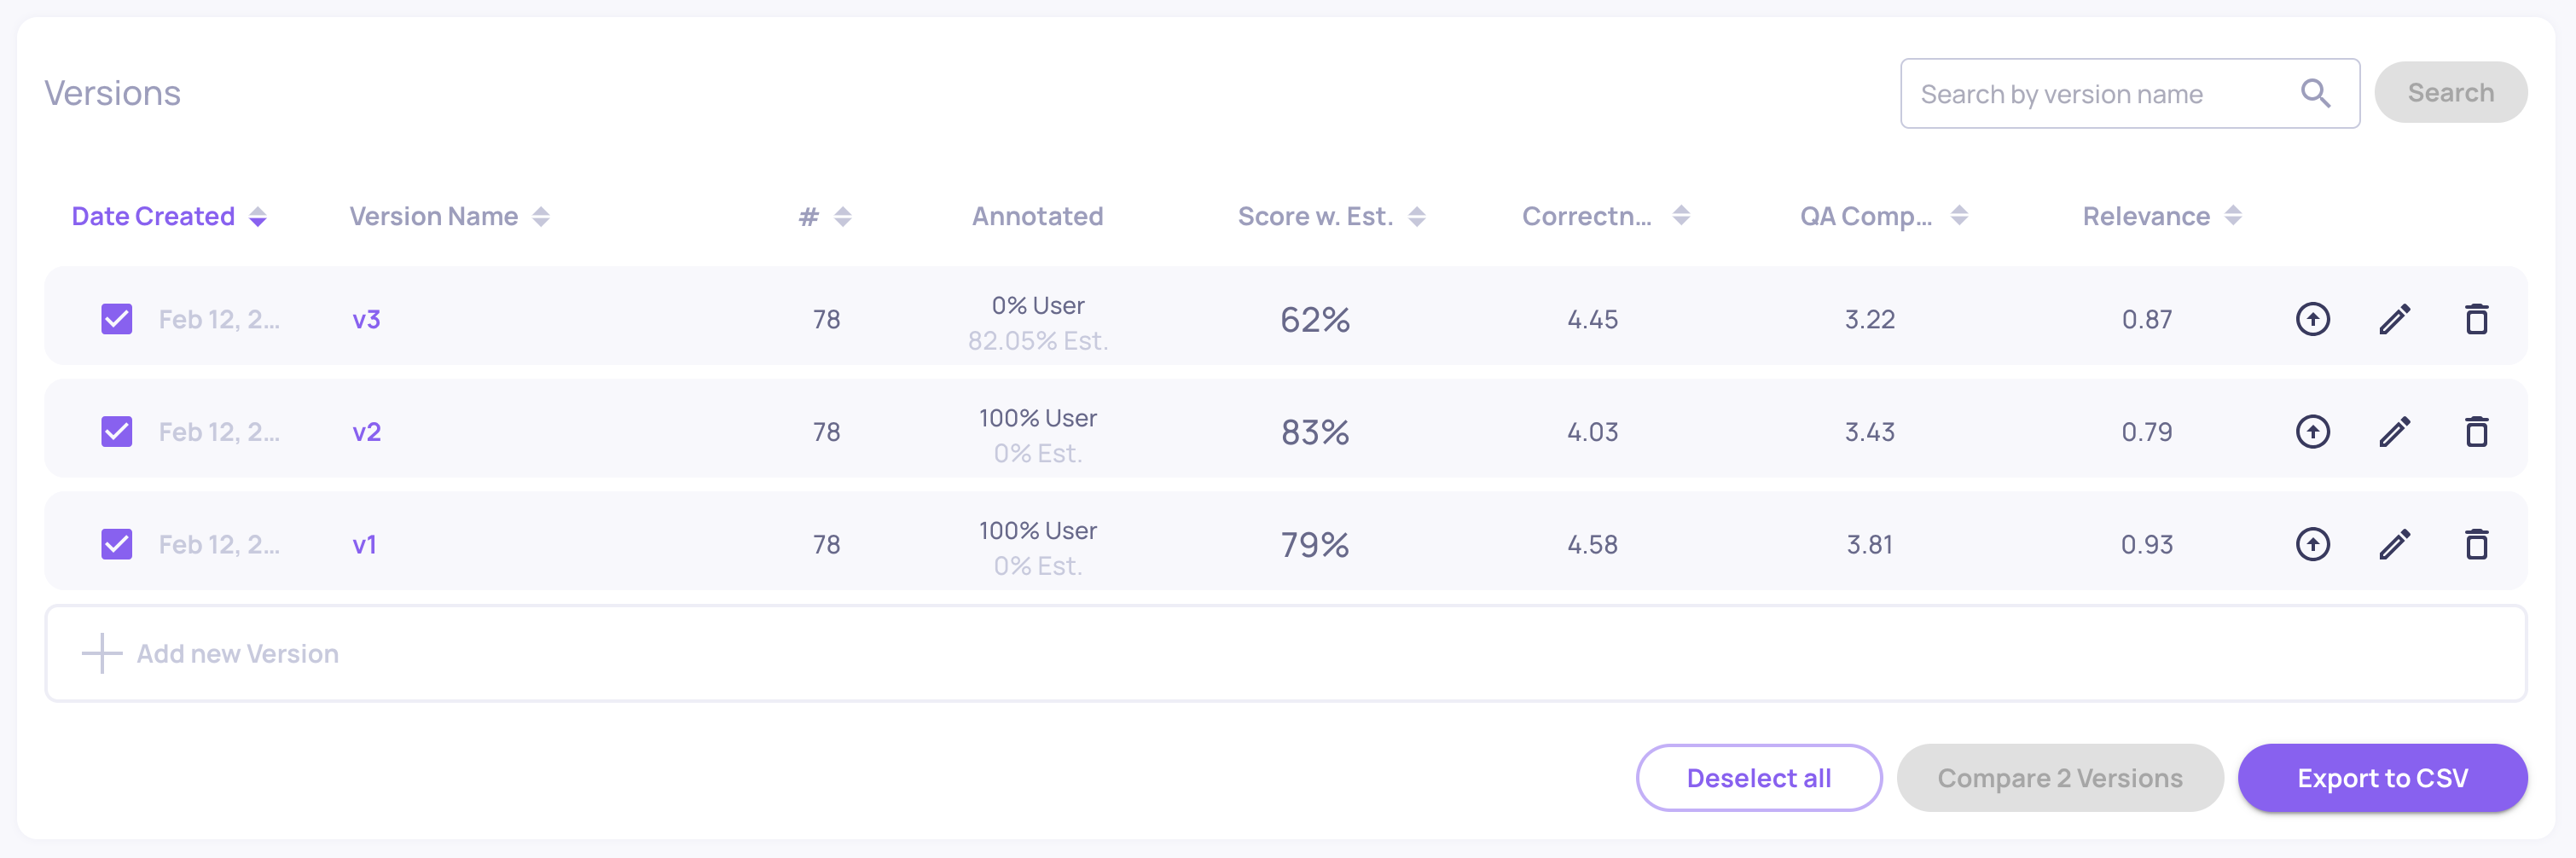
Export to CSV option on the Versions screen
Organization-level logs across applications
Previously, logs were only available per application. Now, you can access a centralized log view for your entire organization - covering all applications - in the Workspace Settings screen (top-right).
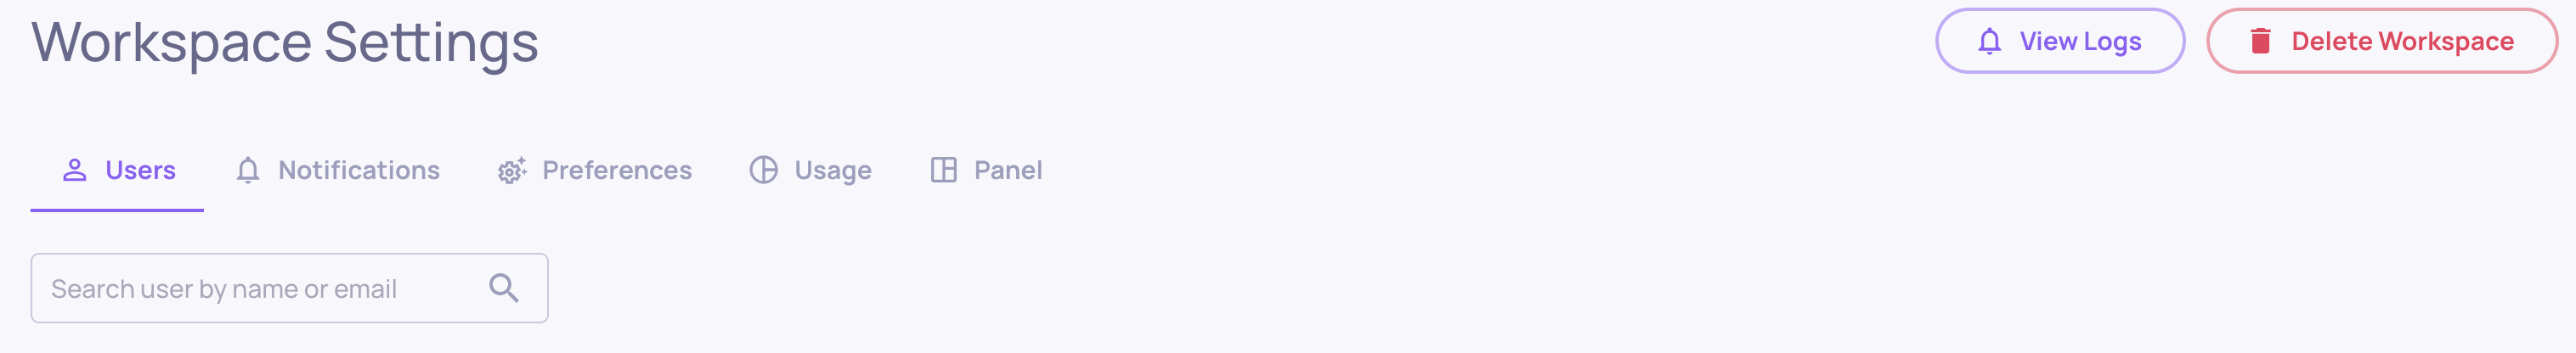
"View Logs" on the organization level on the Workspace Settings screen